
How the Pivot Point Calculator works
The CleaRank Pivot Points Calculator works out intraday support and resistance levels from the previous session’s high, low, and close. It covers classic, Woodie, Camarilla, and Fibonacci pivot formulas, brings in the previous session’s prices for you from live markets, and can even score how accurately pivots have held historically.
Open the Pivot Point Calculator
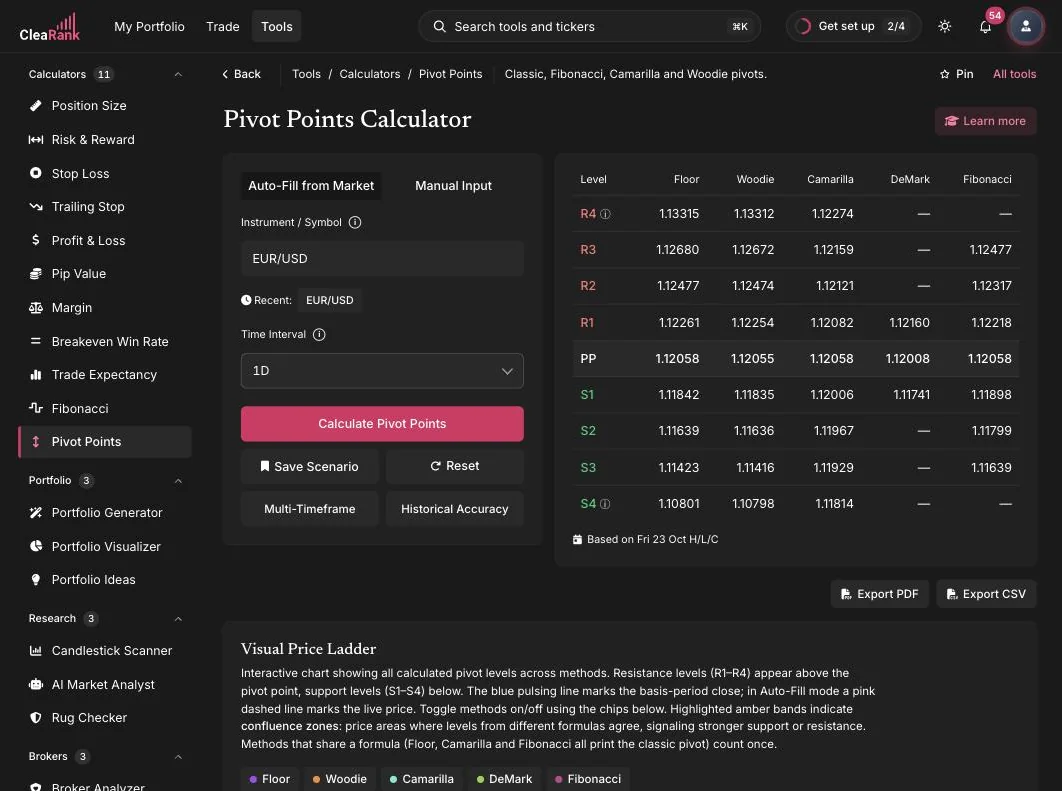
Where today’s support and resistance levels sit
The classic pivot point is the average of the previous period’s high, low, and close. In plain words: P = (High + Low + Close) / 3. Support and resistance rungs are then mirrored around it: R1 = 2P – Low, S1 = 2P – High, R2 = P + (High – Low), S2 = P – (High – Low). Price trading above the pivot is read as intraday bullish bias, below as bearish, and the rungs act as natural entry, stop, and target candidates.
Worked example. Yesterday EUR/USD made High 1.1550, Low 1.1450, Close 1.1500. Pivot P = (1.1550 + 1.1450 + 1.1500) / 3 = 1.1500. R1 = 2(1.1500) – 1.1450 = 1.1550; S1 = 2(1.1500) – 1.1550 = 1.1450; R2 = 1.1500 + 0.0100 = 1.1600; S2 = 1.1400.
The four formula families
- Classic: the standard (H + L + C) / 3 construction above; the most widely watched.
- Woodie: weights the close more heavily, so the pivot reacts faster to where the session actually finished.
- Camarilla: produces a tighter ladder of levels close to the current price, popular with intraday mean-reversion traders.
- Fibonacci: spaces the support and resistance rungs using Fibonacci ratios of the previous range.
Yesterday’s high, low, and close
- Choose the mode. Auto-Fill from Market fetches the previous high, low, and close for you; Manual Input accepts your own high, low, and close.
- Instrument / Symbol. EUR/USD in the screenshot; any supported symbol works.
- Time Interval. 1D gives you daily pivots from yesterday’s candle; other intervals build pivots from the corresponding prior period.
- Calculate Pivot Points. The output is the pivot plus the support and resistance ladder for each formula family.
- Multi-Timeframe. Stacks pivots from several intervals at once, so you can spot where a daily and weekly level coincide.
- Historical Accuracy. Checks how often past pivot levels actually acted as support or resistance for this symbol, useful before you trust them with a stop.
When pivot levels belong in your plan
Inside the Trading Simulator, the calculated levels can be drawn directly on the live chart, so you see price interacting with the ladder in real time. Pivots are most useful for intraday session planning: mapping the day’s likely reaction zones before the open, placing stops just beyond a rung, and pairing a pivot entry with a Fibonacci level for confluence. The dashboard version is included on every plan, including the Free plan, which needs no card. If you only need the levels, the public pivot point calculator at clearank.com/tools/pivot-point-calculator/ is free to use in your browser without an account. The Learn More About Pivot Points panel in the tool goes deeper into the theory.
Frequently asked questions
How do I calculate pivot points?
Average the previous session’s high, low, and close: P = (H + L + C) / 3. Then R1 = 2P – L, S1 = 2P – H, R2 = P + (H – L), S2 = P – (H – L). With H 1.1550, L 1.1450, C 1.1500 you get P = 1.1500, R1 = 1.1550, S1 = 1.1450.
What is the difference between classic, Woodie, and Camarilla pivots?
Classic averages high, low, and close equally. Woodie gives the close extra weight, making the pivot more responsive to the session’s finish. Camarilla generates tighter levels near the current price for short-term reversion trading. Fibonacci pivots space the rungs by Fibonacci ratios of the range.
Which prices does the calculator use?
In Auto-Fill from Market mode it brings in the previous period’s open, high, low, and close for your chosen interval automatically. In Manual Input mode you can type any values, for example from a specific historical session.
How do I know if pivot points work for my symbol?
Use the Historical Accuracy view. It evaluates how often past pivots held as support or resistance for that instrument, so you can judge whether the levels deserve weight in your plan.
Do I need a paid plan to use the Pivot Points Calculator?
No. The dashboard version is included on every plan, including the Free plan, which needs no card. Pro and Unlimited, billed yearly, add more CleaRank Financial AI answers a day (Free has 3), saved scenarios and exports. The public pivot point calculator at clearank.com/tools/pivot-point-calculator/ is free to use in your browser without an account.
Try it yourself
Map today’s key levels before the session starts.
Related articles
CleaRank tools are for education and analysis. Nothing in this guide is financial advice.