
Logging Trades
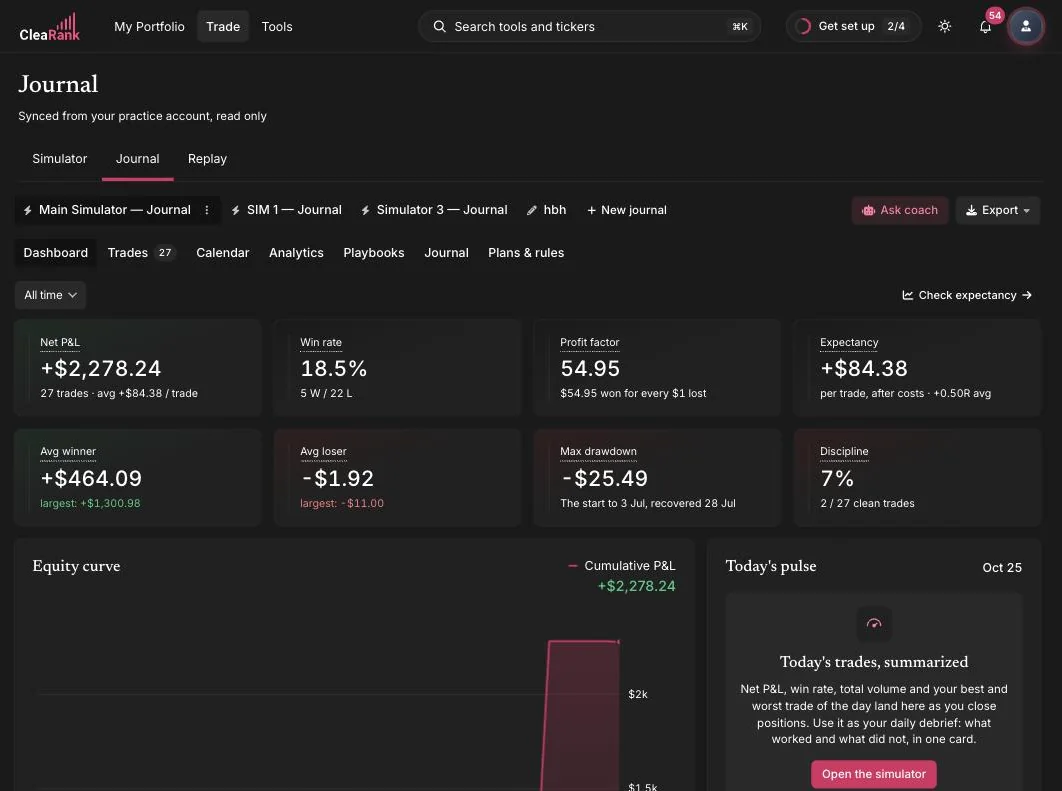
Trades reach the CleaRank Trade Journal three ways: automatically from the Trading Simulator, by hand through the trade editor, or in bulk from a broker CSV. This guide covers manual logging and how mirrored simulator trades behave.
Adding a trade manually
- Open your journal. Go to the Trade Journal and pick the journal you want from the selector at the top of the page.
- Start a new trade. Open the Trades tab and add a trade. A stepped modal opens, titled New Trade.
- Fill in Trade Details. Step 1 holds Symbol, Asset, Side, Quantity, Entry Price, Exit Price, Entry Date, and Exit Date. The two exit fields are optional, so you can log a trade the moment you take it and finish the row when you are out.
- Expand Annotate. Step 2 is optional and collapsed by default. It holds Commission, Stop-Loss, Take-Profit, Confidence, Setup / Strategy, Emotion, and Notes. Assign a setup here so the trade joins your playbook statistics, and record the stop so the trade earns an R-multiple.
- Write your notes and save. Capture why you entered, how you managed it, and what you learned. There is no net P&L field and no R-multiple field to fill in: the journal calculates both from your entry, exit, quantity, stop, and commission.
The banner under the page title tells you what kind of journal you are in. A simulator-linked journal reads Auto-synced from your Trading Simulator. Read-only, every closed sim trade shows up here automatically. A CSV-imported journal reads Imported journal, add trades manually or import more CSVs. A manual journal reads Manual journal, add each trade by hand.
The fields, explained
- Symbol: the instrument you traded.
- Asset: the asset type the trade belongs to.
- Side: the direction, long or short.
- Quantity: the position size, in shares, contracts, or lots depending on the instrument.
- Entry Price and Exit Price: your fill prices. Together with quantity they define the gross result.
- Entry Date and Exit Date: when you got in and when you got out. These place the trade on the calendar and in every time-based statistic.
- Commission: the cost of the trade. Recording it keeps your net P&L honest, because a strategy that wins before fees can lose after them.
- Stop-Loss: where you were prepared to be wrong. This is the number the journal treats as your initial risk.
- Take-Profit: the target you set, which lets you see later how often you actually held for it.
- Confidence: how strongly you believed in the trade, on a scale of 1 to 10.
- Setup / Strategy: the playbook the trade belongs to. This is the only classification field on a trade, and per-setup analytics are built on it.
- Emotion: your state going into the trade: Calm, Frustrated, Greedy, Scared, or Focused.
- Notes: free text for the story of the trade.
The two numbers you will stare at most are not fields at all. Net P&L is calculated from your entry, exit, quantity, and commission. The R-multiple is worked out from the stop you recorded, and it expresses the result in units of your initial risk: a trade that risked $100 and made $250 is +2.5R. R-multiples let you compare trades of different sizes and instruments on equal footing, which is exactly why the Stop-Loss field earns its keep.
Record a Stop-Loss on every trade, even a rough one. Your equity curve tells you how much you made; your R distribution tells you whether the process behind it is sound, and a trade with no stop never reaches that distribution.
The trade detail view
Trades open in a stepped modal. Creating a trade opens it as New Trade. Clicking the pencil icon on a manual row opens the same modal as Edit Trade. Same two steps, same fields, either way.
Step 1: Trade Details
Symbol, Asset, Side, Quantity, Entry Price, Exit Price, Entry Date, and Exit Date. Exit Price and Exit Date are optional, so a trade you are still in can go into the journal now rather than from memory three days later.
Step 2: Annotate
The second step is marked optional. It is collapsed by default and expands when there is already something in it, so reopening an annotated trade shows you what you wrote. It holds Commission, Stop-Loss, Take-Profit, Confidence on a 1 to 10 scale, Setup / Strategy, Emotion, and Notes. The Emotion picker offers five choices: Calm, Frustrated, Greedy, Scared, and Focused.
Optional in the interface does not mean optional in practice. Almost everything interesting in your analytics is born in this step:
- Stop-Loss is what makes an R-multiple possible at all. With no stop on record there is no risk figure to divide by, so the trade is left out of the R-multiple distribution and out of your average R entirely.
- Setup / Strategy is what powers the per-setup table. Without it a journal can tell you that you made money, but not which of your patterns made it.
- Confidence and Emotion are what let you find out later whether your high-conviction trades actually pay better than your low-conviction ones, and whether the trades you took while frustrated are quietly funding everyone else. You can only answer that if you wrote it down at the time.
The trades table
The Trades tab lists your trades under DATE, SYMBOL, SIDE, QTY, ENTRY, EXIT, P&L, R, STATUS, SRC, and ACTIONS. SRC tells you where the trade came from, and ACTIONS is where you act on it: manual rows carry a pencil to edit and a trash icon to delete. A trade with no recorded stop shows a dash in the R column, which makes an unannotated trade easy to spot at a glance.
Mirrored simulator rows carry a padlock in ACTIONS instead. Its tooltip reads Auto-synced from the simulator, read-only. Manage the position in the Trading Simulator.
Simulator trades: mirrored and read-only
Every trade you close in the Trading Simulator is mirrored into your journal automatically, with prices, size, fees, and P&L exactly as they happened. Nobody types anything, nothing gets rounded in your favor, and no trade quietly fails to get logged on a bad day. That is what keeps your statistics truthful.
A mirrored row cannot be opened or edited at all. There is no pencil and no detail modal for it: the only control is the padlock, tooltipped Auto-synced from the simulator, read-only. Manage the position in the Trading Simulator. If you want to change something about the trade, you change it in the simulator, and the journal follows.
To record a post-trade review of a simulator trade, use the journal’s separate Journal tab. It holds dated entries with a Date, a Mood (Focused, Bullish, Bearish, Neutral, or Frustrated), Market Conditions, a free-text body, and Lessons. That is where the reflection goes when the trade row itself is locked.
Editing and deleting manual trades
Manually logged trades stay fully editable. Click the pencil on a row in the Trades tab, or open the trade from an expanded day in the calendar view, change any field across either step, and save. Fixing a typo in an entry price, or adding the stop you forgot, immediately updates the stats that depend on it. The trash icon on the row deletes the trade.
Frequently asked questions
What is an R-multiple?
It is the trade result divided by the amount you initially risked. Risk $100, make $300, and the trade is +3R. Risk $100 and lose $100, and it is -1R. The journal works it out from the Stop-Loss you record, so journaling in R lets you compare trades of different sizes and instruments fairly.
Why does the R column show a dash?
Because that trade has no Stop-Loss on record. R is measured in units of initial risk, so with no stop there is nothing to measure against, and the trade sits outside your R distribution and your average R. Open the trade, expand Annotate, add the stop, and save.
Why can I not edit a simulator trade in the journal?
Mirrored simulator trades are read-only by design, so your win rate, expectancy, and drawdown always reflect what actually happened. The row cannot be opened or edited at all: the only control is a padlock that points you back to the Trading Simulator. To record a post-trade review, use the Journal tab, which holds dated entries with a mood, market conditions, a free-text body, and lessons.
Do fees change my net P&L?
Yes. Net P&L is the result after costs, and the journal statistics are built on net numbers. Recording the Commission on manual trades keeps them comparable with imported and simulator history, where the costs are already included.
Can I assign a setup to a trade after saving it?
Yes, on manual trades. Click the pencil on the row, expand Annotate, pick a Setup / Strategy, and save. Analytics update as soon as you save. Mirrored simulator trades cannot be reopened, so this applies to trades you logged or imported yourself.
Try it yourself
Log your next trade while the reasoning is still fresh.
Related articles
CleaRank tools are for education and analysis. Nothing in this guide is financial advice.