
Reading Your Slippage Audit Grade
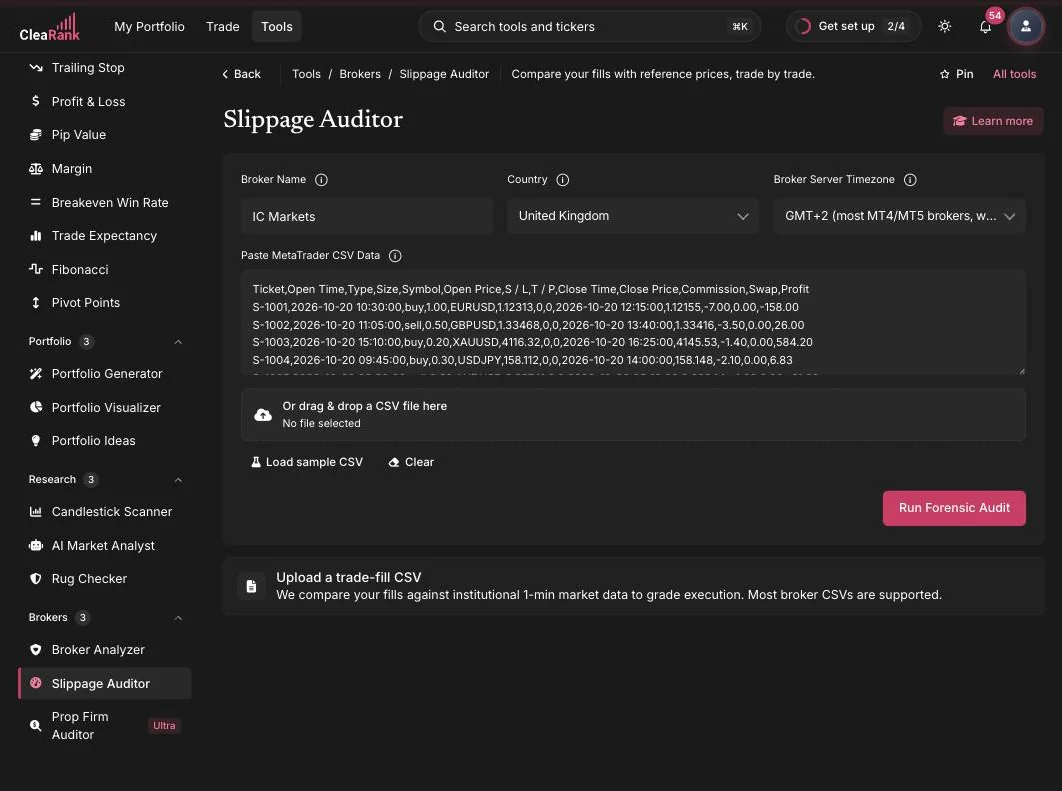
This page explains the result of a CleaRank Slippage Auditor run: the 0 to 100 score bands, the A+ to F letter grade, the per-row labels, the cost projections, and net execution cost. The auditor re-prices every one of your fills against independent one-minute market data rather than the broker’s own record, and each section below covers what a reading means and what to do next.
How the score is built
The audit starts every account at 100 out of 100 and subtracts from there. Two penalties do the work.
Penalty one: slippage per standard lot
Your total measured slippage is divided by your total traded volume in lots, which gives a cost per standard lot in your account currency. This is the number that carries most of the grade, and it is the one worth memorizing.
- More than 30 dollars per lot: 45 points off
- More than 15 dollars per lot: 30 points off
- More than 8 dollars per lot: 18 points off
- More than 3 dollars per lot: 8 points off
- Better than minus 3 dollars per lot, meaning execution consistently in your favor: 5 points added
What good looks like: under 3 dollars per lot is clean, and anything in that band costs you nothing in the grade. Between 3 and 8 dollars per lot is a nuisance that becomes real money at volume. Above 8 dollars per lot you are paying a meaningful second spread on every trade, and the usual next steps are to ask the broker for an execution report on the affected symbols, to test the same strategy on a different account type such as raw spread versus standard, and to stop trading the worst instruments at the worst times of day.
Penalty two: slippage as a share of expected profit
The second penalty compares your total slippage with the gross profit or loss those trades were expected to produce. It answers a different question: not “is this expensive” but “is this eating the edge”.
- More than 50 percent of expected gross profit and loss: 25 points off
- More than 25 percent: 15 points off
- More than 10 percent: 8 points off
A scalping strategy can post a modest per-lot cost and still trip this penalty, because its expected profit per trade is small. If this is where your points are going, the fix is usually the strategy’s time horizon, not the broker: targets that are only a few times the size of your execution cost will always be fragile.
The small-sample guard
An audit with fewer than 3 verified trades is capped at 70 no matter how clean it looks, and one with fewer than 5 is capped at 85. You need at least one verified trade to get any grade at all. This is deliberate. Three good fills do not prove a broker executes well, and the tool refuses to imply otherwise. For a conclusion you would act on, aim for several dozen trades across more than one session.
The letter grade
- A+ at 95 and above
- A from 88 to 94, described in the tool as excellent execution
- B from 80 to 87, good execution with minor drag
- C from 70 to 79, average execution with measurable drag
- D from 55 to 69, poor execution that is materially eating returns
- F below 55, failing execution and a major cost center
- N/A when no trade in the file could be verified against market data
Treat B as the working target for a retail account. A and A+ are achievable on liquid instruments in liquid hours. A C is worth a conversation with your broker. A D or an F on a decent sample size is a reason to price a move, and the cost projections below tell you what that move is worth annually.
Drag, Favourable, Clean and No data
The QUALITY column uses four labels: Drag, Favourable, Clean and No data. The words are the same in the per-instrument table and the per-trade table, but the thresholds behind them are different, and confusing the two is the single easiest mistake to make on this screen.
In the per-instrument table
Instruments are judged on their total slippage across every trade in that symbol, in your account currency. More than 0.50 dollars total is Drag. Less than minus 0.50 dollars, meaning the fills came out ahead in aggregate, is Favourable. Anything between is Clean. If no independent market price could be found for that symbol, the row reads No data.
In the per-trade table
Individual trades are judged per lot, so size does not distort the label. More than 3 dollars per lot is Drag. Less than minus 3 dollars per lot is Favourable. Within plus or minus 3 dollars per lot is Clean, and a trade with no verified reference price reads No data.
The expected versus actual convention
Expected is the independent market price closest in time to your fill, taken from one-minute bars. Actual is the price your broker actually gave you. Slippage is the difference, expressed in your account currency, and the sign is consistent throughout the report: a positive number is a cost to you and a negative number means the fill landed in your favor.
A few mechanics worth knowing, because they explain most surprises in the report.
- A fill is matched to the nearest one-minute bar. If the nearest bar is more than 60 minutes away, which usually means a weekend or a data gap, the reference price is discarded rather than used.
- When no market data can be attached, the trade is marked as having no market data and its slippage is recorded as zero, not as an error. Those trades neither help nor hurt the grade.
- If only one side of a trade resolves, the missing side falls back to the broker’s own price for that leg.
- Instruments quoted in a currency other than your account currency are converted, using the rate implied by your broker’s own profit column when that is trustworthy.
- Broker symbol suffixes such as EURUSDm, XAUUSD.raw or NAS100c are recognized and set aside when your fills are checked against market prices, so you do not need to clean your file first.
- A standard lot means 100,000 units for forex, 100 ounces for gold, 5,000 ounces for silver, 1,000 units for oil and natural gas, and 1 unit for crypto and index CFDs.
The session breakdown
Trades are also grouped into UTC session buckets: Asia from 00:00 to 07:00, London from 07:00 to 12:00, the London and New York overlap from 12:00 to 16:00, New York from 16:00 to 21:00, and Quiet from 21:00 to 24:00. Execution costs are not evenly spread across the day, and this is the fastest way to see it. If your Drag concentrates in the Quiet bucket, that is thin liquidity rather than a broker conspiracy, and the fix is in your schedule.
The plain-language verdict
Above the tables sits a short verdict headline with a badge showing whether it came from CleaRank Financial AI or from the built-in rules. When the AI summary is unavailable, or when you are not signed in, the headline is one of exactly four phrases:
- Not Enough Data when there is no grade
- Execution Looks Solid at a score of 88 or above
- Mixed Execution Quality at 70 or above
- Execution Dragging Profits below 70
The AI version is not restricted to those four. It writes its own short phrase, but it is required to align with the letter grade, so an A never gets a negative headline and an F never gets a flattering one. Either way, the headline is a summary of the score you can already see. The numbers, not the sentence, are what you take to a broker.
Cost Projections and NET EXECUTION COST
Measuring the past is only half the point. The Cost Projections block scales the execution cost measured across your audited sample out to a longer horizon at the same rate of trading, which is how a number like “2.40 dollars per lot” becomes an annual figure you can actually weigh against the effort of changing broker.
NET EXECUTION COST is the bottom line of that block: what your fills cost you across the audited sample once execution in your favor has been netted against execution against you. Net is the operative word. A broker that gives you 4 dollars of positive slippage on some fills and takes 6 on others is not neutral, it is costing you 2, and this line is where that shows up as one figure.
Two honest caveats. The projection assumes your future trading resembles the audited sample in size, instruments and timing, so it is a scenario rather than a forecast. And it only covers what the audit could verify: trades marked No data contribute zero, which makes the projection conservative rather than alarmist.
Sample limits, and what gets rejected
- Signed in, an audit covers up to 200 trades, and each run checks a limited number of your trades against independent reference prices. Once that limit is reached, the remaining trades are marked as unverified and a note is added to the report so you know the coverage was partial. If you have a large file, split it across several runs.
- Signed out, the limit is 10 trades, which is enough to see how the tool works but not enough for a conclusion.
- Files where every trade is in the future, or where every trade is more than five years old, are rejected outright rather than silently producing nonsense.
- European CSV exports that use semicolons as separators and commas as decimal points are detected automatically, and the report tells you when that happened.
Save Audit and exports
Save Audit keeps the completed run so you can reopen it later. That matters more than it sounds: one audit is a snapshot, and the useful evidence is the same broker audited across several months, or the same strategy audited on two brokers side by side. Alongside saving, the auditor exports to CSV, JSON and PDF, and the PDF is the format to attach to a support ticket when you want the broker to explain a pattern.
For a summary of the tool without signing in, see the slippage calculator and broker fee analyzer page on clearank.com. If your audit turns up structural problems rather than execution ones, the Broker Analyzer is the tool for that side of the question.
Frequently asked questions
Why is my grade capped even though every trade looked clean?
Because of the small-sample guard. Fewer than 3 verified trades caps the score at 70 and fewer than 5 caps it at 85. Upload a larger history and the cap lifts.
Some trades show No data. Did the audit fail?
No. Those trades could not be matched to an independent market price within an hour, usually because of a weekend, a holiday or a gap in coverage, or because the run had already checked as many trades as one audit can verify. They are recorded with zero slippage so they neither improve nor damage your grade, and you can split a large history across several runs to cover the rest.
Why does an instrument show Drag when all its individual trades read Clean?
Because the two tables use different thresholds. Instruments are judged on total slippage above 0.50 dollars, trades on more than 3 dollars per lot. Many small per-lot costs add up to a large total, which is exactly the pattern worth catching.
Can negative slippage improve my score?
Yes. Execution consistently better than minus 3 dollars per lot adds 5 points. Consistent positive slippage is unusual, so check your timezone setting before celebrating it.
Is a poor grade proof my broker is treating me unfairly?
No, and it should not be presented that way. Slippage also comes from thin liquidity, news volatility, wide stops on illiquid symbols and your own order types. The audit tells you where the cost is concentrated so you can ask a specific, answerable question.
Try it yourself
Upload a trade history and see what your fills actually cost.
Related articles
CleaRank tools are for education and analysis. Nothing in this guide is financial advice.