
Slippage and Fee Auditor
The CleaRank Slippage and Fee Auditor checks your broker’s execution fill by fill. Upload your trade history and every fill is verified against independent 1-minute market data, then graded per instrument, per session, and per trade, with cost projections, a CleaRank Financial AI execution review, and CSV, JSON, and PDF exports.
What it verifies
Slippage is the difference between the price you should reasonably have received and the price your broker actually filled you at. Spread markups, fees, and swap charges add further costs that are easy to overlook trade by trade but add up fast. The auditor compares each fill in your history against independent 1-minute reference prices for the same instrument at the same moment, grades execution quality, and flags hidden costs.
Run a forensic audit
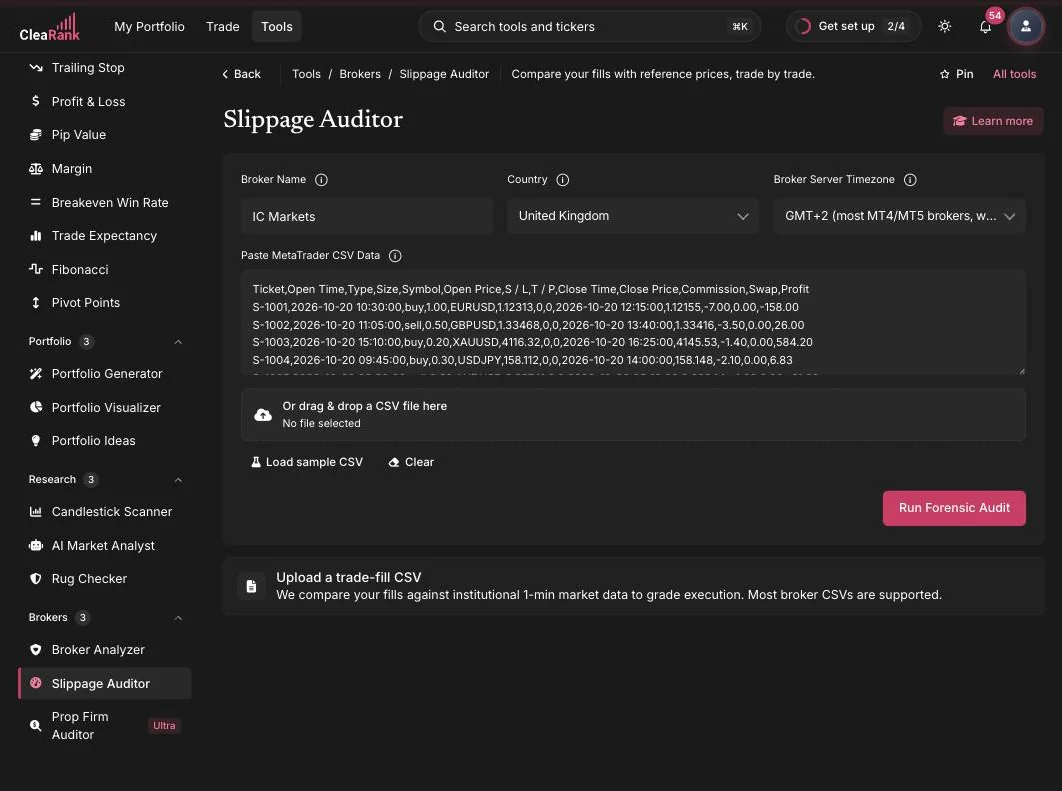
- Enter your broker details. Fill in the Broker Name (for example IC Markets, Pepperstone, XM) and select the Country.
- Set the broker server timezone. Most MT4/MT5 brokers run on GMT+2 in winter, which is the default. Pick the timezone your broker’s server actually uses so your fill times line up with the reference data.
- Add your trade history. Paste MetaTrader CSV data (columns: Ticket, Open Time, Type, Size, Symbol, Open Price, Close Time, Close Price, Commission, Swap, Profit) or drag and drop a CSV file. European number formats and MT4/MT5 symbol suffixes are handled automatically.
- Run it. Click Run Forensic Audit. If you just want to see how the tool works, click Load Sample CSV first and audit the sample data.
How grading works
Results are broken down three ways so you can find where costs concentrate:
- Per instrument. Which symbols consistently fill well and which quietly bleed. A broker can be excellent on EUR/USD and poor on exotics.
- Per session. Execution quality by trading session, since spreads and slippage behave differently in quiet and busy hours.
- Per trade. Every individual fill with its measured slippage, so outliers are visible instead of buried in averages.
The letter grade and the 0 to 100 score
Every audit starts your account at 100 and deducts for execution drag. Whatever is left is your score, and the score maps to a letter grade:
- A+ (95 and above) and A (88 to 94): excellent execution.
- B (80 to 87): good execution with minor drag.
- C (70 to 79): average execution with measurable drag.
- D (55 to 69): poor execution that is materially eating your returns.
- F (below 55): failing execution and a major cost center.
- N/A: no verified trades, so no grade is given at all.
The main input to the deduction is slippage per standard lot, which means the grade is measured on a per-lot basis: a 0.01 lot trade and a 10 lot trade are judged on the same scale, so a big position is never penalized simply for being big. A secondary deduction applies when slippage eats a large share of the expected gross profit or loss on a trade. That second test is what separates drag you can absorb from drag that changes the outcome of the trade.
For a longer walkthrough of what each band means in practice and what to do about a poor one, read Reading Your Slippage Audit Grade.
How much one audit covers
Signed in, one audit covers up to 200 trades. Signed out, it is capped at 10 trades, which is enough to see how the tool behaves before you commit a full history to it.
Each run also checks a limited number of your trades against independent reference prices. Trades on the same instrument on the same day are checked together, so a history concentrated in a few symbols gets more of itself verified than one spread thinly across many. Once that limit is reached, the remaining trades are marked as unverified and the report says so, rather than filling the gap with a guess. If you have a large file, split it across several runs.
Unverifiable trades and the “No data” rows
Each fill is matched to the nearest one-minute bar in the reference data. If the nearest bar is more than 60 minutes away from the fill time, which is what happens across a weekend, a market holiday or a gap in the data, the quote is discarded, the trade is marked as having no market data, and its slippage is recorded as $0 rather than failing the audit.
That has a consequence worth knowing before you read your grade. Those trades sit in the results at $0 slippage, so they quietly pull your averages toward zero and can make execution look better than the verified sample actually supports. Check the verified-trade count before you take the grade at face value. The per-instrument and per-trade tables show “No data” on exactly these rows, so you can always see which fills carry evidence and which do not.
Cost projections and the CleaRank Financial AI review
The audit projects your measured execution costs forward, showing what staying with this execution quality will cost you over time. A CleaRank Financial AI execution review then summarizes the findings in plain language: where your costs come from, which patterns stand out, and what is worth raising with your broker.
Exporting your audit
Reports export to CSV, JSON, and PDF. The PDF is useful when you want to show your broker exactly which fills you are questioning; the CSV and JSON exports feed your own further analysis.
See also the slippage calculator and broker fee analyzer page on the marketing site at clearank.com/tools/slippage-calculator-broker-fee-analyzer/.
Frequently asked questions
What file format does the auditor accept?
MetaTrader-style CSV exports, pasted or dragged in. The expected columns are Ticket, Open Time, Type, Size, Symbol, Open Price, Close Time, Close Price, Commission, Swap, and Profit. European decimal formats and broker symbol suffixes are handled automatically.
What exactly is slippage?
The difference between the expected price of a trade and the price it actually filled at. Some slippage is normal in fast markets, but consistent one-sided slippage against you is a cost worth quantifying.
What does my letter grade mean?
The audit starts at 100 and deducts for execution drag. 95 and above is A+, 88 to 94 is A (excellent execution), 80 to 87 is B (good execution with minor drag), 70 to 79 is C (average execution with measurable drag), 55 to 69 is D (poor execution that is materially eating your returns), and below 55 is F (failing execution and a major cost center). With no verified trades the grade is N/A.
Why is my score capped even though my execution looks clean?
Small samples are capped on purpose. Fewer than 3 verified trades caps the score at 70, and fewer than 5 caps it at 85, so a thin upload cannot earn an A. Add more trade history and the cap lifts.
Why do some trades show “No data”?
Each fill is matched to the nearest one-minute reference bar. If the nearest bar is more than 60 minutes away, for example across a weekend, a holiday or a gap in the data, the quote is discarded and the trade is marked as having no market data. Its slippage is recorded as $0 rather than failing the audit, which means those rows pull your averages toward zero. Check the verified-trade count before reading too much into the grade.
How many trades can one audit cover?
Signed in, up to 200 trades per audit. Signed out, it is capped at 10 trades. Each run also checks a limited number of those trades against independent reference prices, and trades on the same instrument on the same day are checked together. Once that limit is reached, the remaining trades are marked as unverified and the report tells you so, so you can split a large history across several runs.
Why do I need to set the broker server timezone?
Your CSV records fill times in your broker’s server time. The auditor needs to align those timestamps with independent 1-minute reference prices, so a wrong timezone shifts every comparison to the wrong minute.
Can I try the auditor without my own trade history?
Yes. Click Load Sample CSV to load example data and run a full audit on it before uploading your own history.
What reference data are fills compared against?
Independent 1-minute market data for the same instrument and minute as each fill, sourced separately from your broker, which is what makes the audit a genuine second opinion.
Try it yourself
Find out what your broker’s execution really costs.
Related articles
CleaRank tools are for education and analysis. Nothing in this guide is financial advice.