
Trade Journal
The CleaRank Trade Journal records what you traded, why you took it, and how it went, then turns that history into statistics. This section covers logging trades by hand, importing a broker CSV, the dashboard and calendar views, playbooks, goals and trading rules, and the analytics charts.
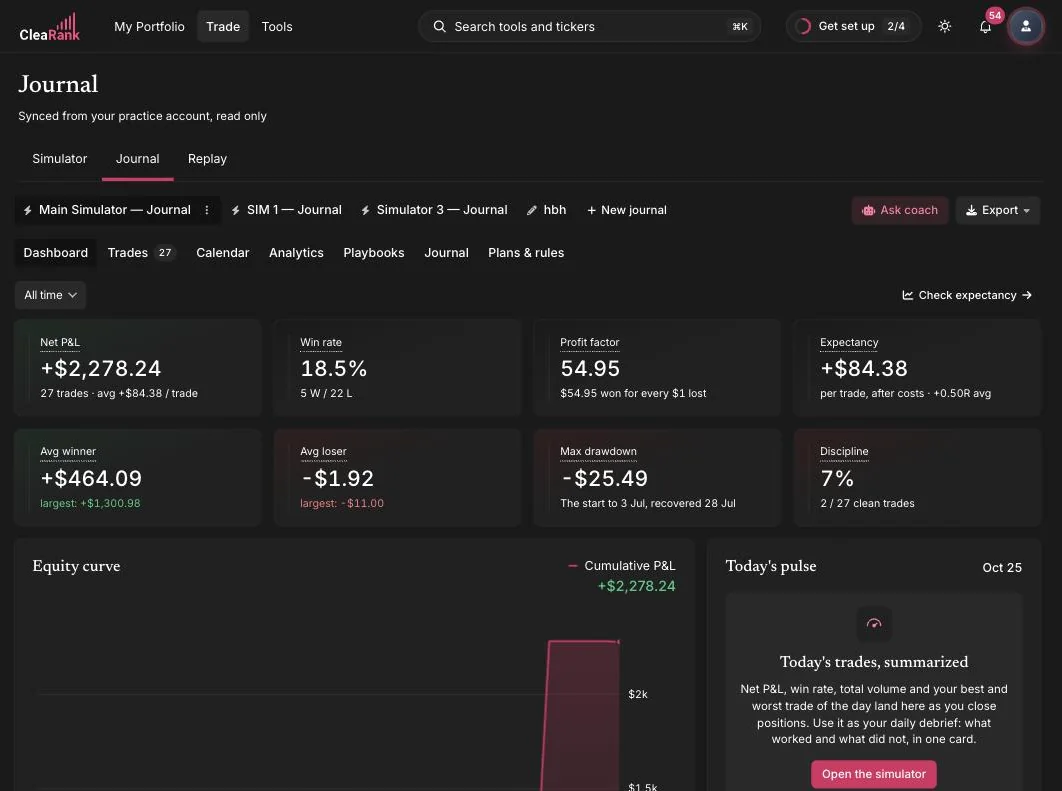
What the Trade Journal does
Every trade in your journal carries the full story: symbol, side, entry and exit prices, size, fees, net P&L, R-multiple, the setup you traded, tags, and free-form notes. From that record, the Dashboard tab builds a Performance at a Glance panel with Net P&L, Win Rate, Profit Factor, Expectancy, Average Winner, Average Loser, Max Drawdown, and a Discipline score. The money and win-rate metrics follow the time-window filter you pick. The Discipline score is the exception: it is always all-time.
The journal is organized into tabs: Dashboard, Trades, Calendar, Analytics, Playbooks, Journal (free-form entries), and Plans & Rules. Each one is covered in its own guide below.
Simulator trades journal themselves
You do not have to log practice trades by hand. Every trade you close in the Trading Simulator is mirrored into your journal automatically, marked as auto-synced and read-only. The numbers stay exactly as they happened, and you add your review on top as post-trade annotations: what you saw, what you did well, what you would change.
Mirrored simulator trades are read-only by design. Your stats always reflect what actually happened in the simulator, so your win rate and expectancy cannot be edited into looking better than they are.
Multiple journals, one account
You can keep more than one journal. A common split is one journal per simulator account (created automatically) plus a separate journal for trade history you import from a broker CSV. Switch between journals with the journal selector at the top of the page, and create another with the New Journal button. Each journal keeps its own trades, playbooks, and analytics. Your trading rules are the exception: you write them once for your account, and they apply to every journal you own.
When you want to test a journal against prop-firm evaluation rules, the journal links straight into the Prop Firm Auditor, which can audit any journal against a firm’s drawdown, consistency, and trading-day rules.
Discipline score and the Tiltmeter
The discipline score is the share of your closed trades that broke none of your own trading rules, shown from 0 to 100 percent. The Tiltmeter is that same number drawn as a gauge, not a second reading pointing the other way: it rises as your behavior improves and falls when you break your rules.
Because rules belong to your account rather than to one journal, the score covers every journal you own, and the dashboard tile has no time filter on it: the figure is all-time. Simulator trades are measured against the same rules, so editing a rule re-scores your simulator history.
On the tile, 80 percent and above reads as good, 60 to 79 percent shows as a warning, and below 60 percent reads as bad. The app treats 80 percent as the informal target, so that is a fair line to aim for. The trend arrow compares your last two weeks that actually contained trades, and there is no tolerance band: a one-point difference already flips the arrow, and steady means the two weeks came out exactly equal.
With no rules written there is no score at all: the tile shows a dash and a Set rules prompt, not a perfect 100 percent. The minimum sample is one closed trade, so a single trade can read 0 percent or 100 percent. Treat the number as noisy until you have a real run of trades behind it.
How each rule is tracked, and how to write rules that are worth measuring, is covered in Goals and trading rules.
Guides in this section
Frequently asked questions
Do simulator trades appear in the journal automatically?
Yes. Every closed trade from the Trading Simulator is mirrored into your journal automatically. The journal header shows that it is auto-synced, and mirrored trades are read-only.
Can I edit a mirrored simulator trade?
The trade data itself is read-only so your statistics stay honest. You can add post-trade review annotations, such as notes on execution quality and what you would do differently.
Can I import trades from my real broker?
Yes. The journal imports broker CSV exports and handles European number formats, MT4/MT5 symbol suffixes, and broker timezone offsets. See the CSV import guide for the steps.
Can I keep separate journals for different strategies?
Yes. You can create multiple journals and switch between them from the selector at the top of the page. Each journal keeps its own trades, playbooks, and analytics. Trading rules are the exception: they are set once for your account and apply to every journal.
Does each journal have its own trading rules and discipline score?
No. You define your rules once for your account, and they apply across every journal you own, so the discipline score is a single all-time figure spanning all of them. It is the share of your closed trades that broke none of your rules, and it rises as your behavior improves.
Is the Tiltmeter separate from the discipline score?
No, they are the same number. The Tiltmeter is the discipline score drawn as a gauge, so it rises as you follow your rules. On the tile, 80 percent and above reads as good, 60 to 79 percent as a warning, and below 60 percent as bad.
Try it yourself
Open your journal and see your last trades summarized in one dashboard.
Related articles
CleaRank tools are for education and analysis. Nothing in this guide is financial advice.