
How Emerging Crypto Trends work
Emerging Trends is CleaRank’s crypto market intelligence dashboard. It surfaces trending themes and assets with momentum context: the Crypto Fear and Greed index, market cap and volume, BTC and ETH dominance, trending tokens, top gainers and losers, and a plain-English CleaRank Financial AI market narrative.
Open the Emerging Crypto Trends
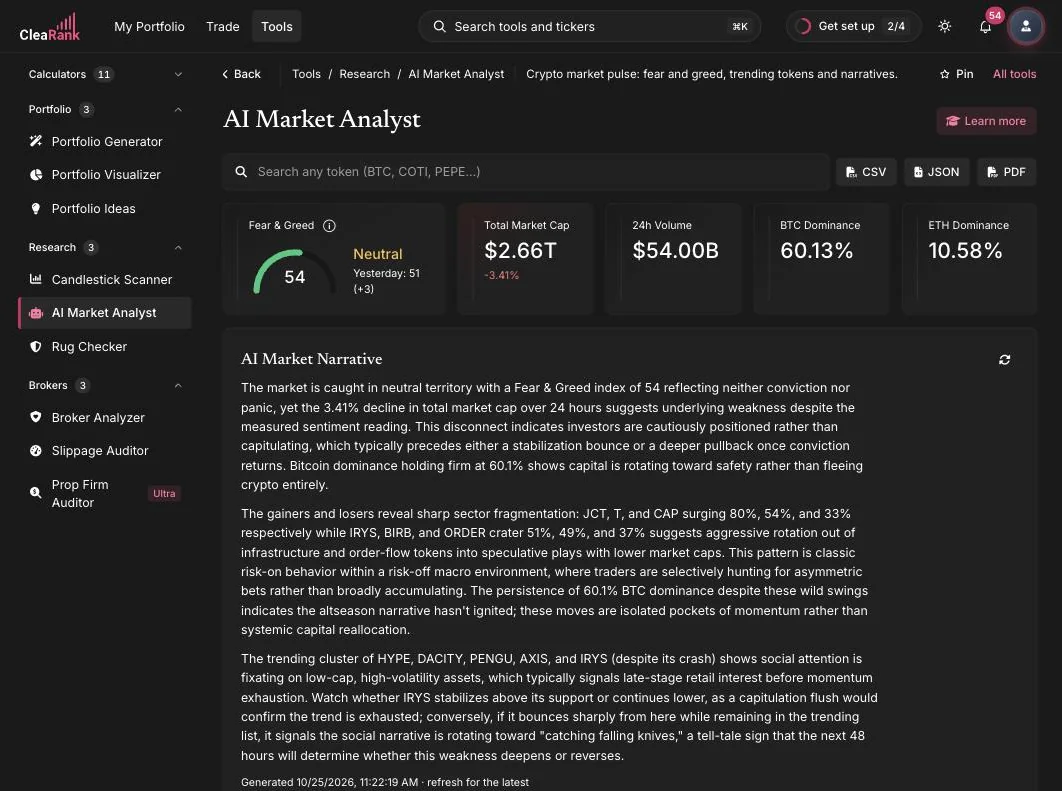
The headline stats
The top row gives you the state of the crypto market at a glance:
- Fear & Greed. The widely used Crypto Fear and Greed Index on a 0 to 100 scale, with yesterday’s reading for comparison. Low values signal fear, high values signal greed.
- Total market cap and 24h volume. The overall size of the crypto market and how actively it is trading, with the day’s percentage change.
- BTC and ETH dominance. Bitcoin’s and Ethereum’s shares of total market cap. Shifts in dominance often mark rotations between Bitcoin and altcoins.
Where the Fear and Greed number comes from
CleaRank does not calculate this one. It is the widely used Crypto Fear and Greed Index, passed through as published: both the value and the wording of the label (Extreme Fear through Extreme Greed) come from that external index, and CleaRank only chooses the color of the gauge. It is a crypto sentiment index, so read it as a comment on crypto positioning, not as a verdict on stocks.
The index bands are:
- 0 to 24: Extreme Fear
- 25 to 49: Fear
- 50: Neutral
- 51 to 74: Greed
- 75 to 100: Extreme Greed
These bands belong to the external index. The sentiment gauge on the simulator’s News tab is a different measure with different bands, so do not read the two as interchangeable.
An extreme reading tells you how crowded current positioning feels, which is useful context for sizing and for patience. It is not a timing signal, and it does not tell you that a turn is due.
The CleaRank Financial AI market narrative
Below the stats, the AI Market Narrative turns the raw numbers into a few readable paragraphs: what the sentiment reading suggests, which tokens are moving and why that matters, and what the trending list implies about where attention is flowing. Each narrative is timestamped when it was generated.
The view refreshes on a schedule rather than on every visit: roughly every ten minutes for the index and market stats, and less often for the AI-written sections. In between refreshes, the reading you already saw is reused, so the page comes back instantly and a reload will usually hand you the same numbers and the same text. Treat the timestamp as the age of what you are reading rather than reloading in the hope of a fresher value.
Trending tokens, gainers, and losers
Three lists track where the action is: Trending shows tokens attracting social and market attention, Top Gainers (24h) and Top Losers (24h) show the day’s biggest movers with prices and percentage changes. You can also search any token directly from the search bar at the top of the tool.
Momentum context cuts both ways: a token topping the gainers list is also a token that can top the losers list tomorrow. Before acting on a small or unfamiliar trending token, run it through the Crypto Rug Checker first.
Exporting the data
The CSV, JSON, and PDF buttons at the top of the tool export the current market snapshot, so you can archive readings, feed them into your own analysis, or share a formatted report.
See also the Emerging Crypto Trends page on the marketing site at clearank.com/tools/emerging-crypto-trends/.
Frequently asked questions
What does the Fear and Greed index measure?
It condenses crypto market sentiment into a 0 to 100 score. CleaRank does not calculate it: this is the widely used Crypto Fear and Greed Index, and both the number and the wording of its label come straight from that external index, with CleaRank choosing only the gauge color. Readings near the bottom signal widespread fear and readings near the top signal greed. It is a crypto index, so it is not a verdict on stocks.
What are the Fear and Greed bands?
The external index reads 0 to 24 as Extreme Fear, 25 to 49 as Fear, exactly 50 as Neutral, 51 to 74 as Greed, and 75 to 100 as Extreme Greed. The sentiment gauge in the Trading Simulator’s News tab is a separate measure with different bands, so the two are not interchangeable.
Does an extreme reading mean a reversal is coming?
No. An extreme reading tells you how crowded current positioning feels, which is context for how much size to take and how patient to be. It is not a timing signal and it does not predict a turn.
Why does the reading not change when I reload the page?
The view refreshes on a schedule rather than on every visit, roughly every ten minutes for the index and market stats and less often for the AI-written sections. In between refreshes, the reading you already saw is reused, so it comes back instantly and a reload will usually return the same value. The timestamp on the narrative tells you how old the current view is.
What is BTC dominance and why does it matter?
BTC dominance is Bitcoin’s share of the total crypto market cap. Rising dominance usually means capital is favoring Bitcoin over altcoins; falling dominance often accompanies broad altcoin rallies.
Does Emerging Trends cover stocks too?
Emerging Trends focuses on the crypto market. For stock movers, use the Screener tab inside the Trading Simulator, which covers gainers, losers, most active, high volume, and breakouts across stocks, crypto, and forex.
Can I export what I see?
Yes. The CSV, JSON, and PDF buttons export the current snapshot, including the market stats and token lists.
Try it yourself
See what the crypto market is doing right now.
Related articles
CleaRank tools are for education and analysis. Nothing in this guide is financial advice.