
Simulator Workspace and Panels
The CleaRank Trading Simulator workspace is built from eight panels you can add, move, remove, and save as named layouts. This guide covers arranging panels, saving and switching between layouts, and reading the DOM ladder and the Trade Tape.
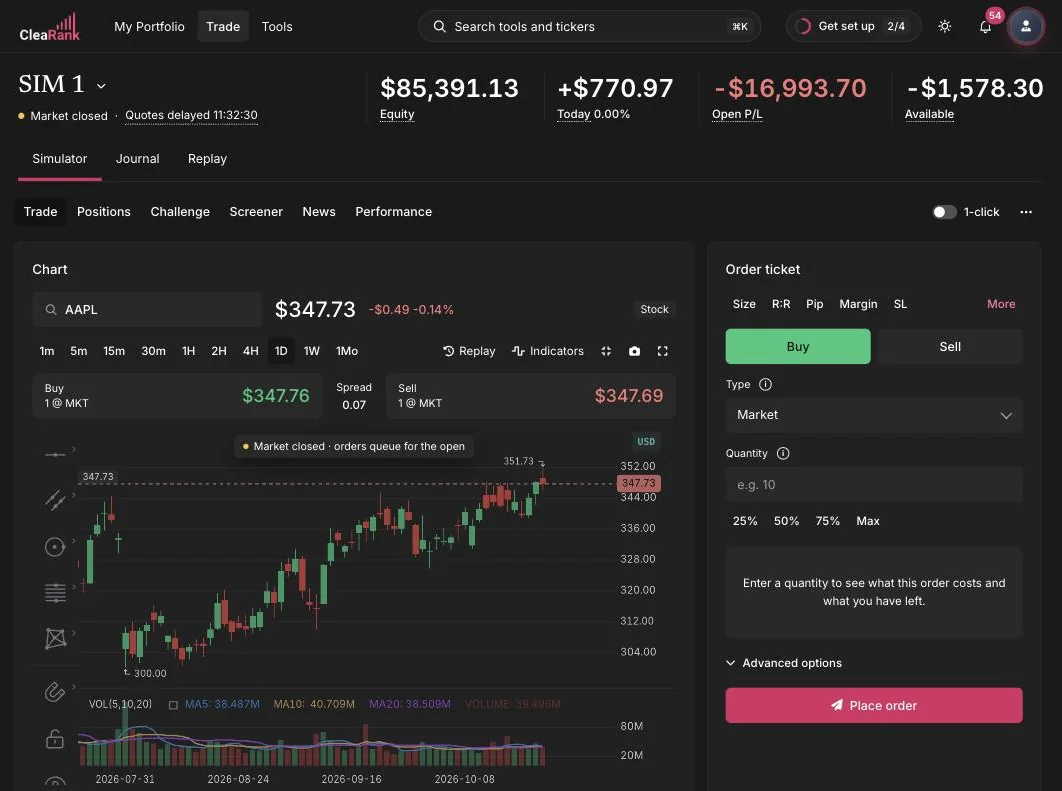
Workspaces: one layout per job
Most traders need two or three screens, not one. A layout built around the ladder and the order ticket is the right screen for working an entry. A layout built around the chart, positions and the Trade Tape is the right screen for managing what you already hold. A workspace is a saved arrangement of panels, and the selector on the left of the workspace bar switches between them.
- Save writes the current arrangement back to the workspace you have selected. The keyboard shortcut is Ctrl or Cmd plus S.
- Save As creates a new named workspace from what is on screen right now. Use it when you want to keep the layout you already have and branch a variation from it.
- Reset Layout restores the default arrangement. Panels you removed come back and any custom positioning is discarded.
- Every new simulator starts on Default, so there is always a known-good layout to fall back to.
Name workspaces after the job rather than the instrument. “Scalp”, “Manage” and “Ladder” stay useful across every symbol you trade, while “AAPL” stops being useful the moment you switch tickers. Changes are not permanent until you press Save, so you can experiment freely and simply switch workspaces to discard the mess.
The panel catalog
Add Panel opens a menu of the eight panels the workspace can hold. If a panel is already on screen the menu tells you so rather than adding a duplicate. Each one answers a different question, which is the useful way to decide whether you need it.
- Chart. Where price has been. Candles, timeframes from one minute to one month, indicators, drawing tools and the calculator chips that read the symbol you are looking at. See Charts and Indicators.
- Order Ticket. Where you commit. Buy and Sell, the five order types, quantity, brackets and the cost estimate. See Placing Orders.
- DOM Ladder. A price ladder centered on the last price, for placing orders at a level instead of at the market.
- Markets. A browser for symbols, with Featured, Stocks, Forex, Crypto and Futures tabs. Use it when you are looking for something to trade rather than tracking a specific list.
- Watchlist. The symbols you follow, with a small price sparkline on each row and price alerts you can arm from the bell. See Watchlist and Price Alerts.
- Positions. What you currently hold, with live profit and loss, brackets and close controls.
- Pending Orders. What has not filled yet. Keep this one visible whenever you work limit or stop entries, because an order you forgot about is the one that fills at the worst time.
- Trade Tape. A running feed of executions, both yours and the market’s.
Moving and removing panels
Each panel header carries its own controls on the right: move left, move right, move row up, move row down, and a close cross. Panels move by whole grid slots rather than by free dragging, which keeps the grid tidy and makes the same layout reproducible on a different screen size.
Closing a panel removes it from the layout, not from your account. Nothing is lost: Add Panel puts it back, and the change only becomes permanent when you press Save. If a layout gets away from you, switch workspaces or press Reset Layout.
Reading the DOM Ladder
A chart tells you where price has been. A ladder tells you what is sitting in front of it right now, and just as importantly it lets you place an order at a chosen price rather than at whatever the market is doing when you click. The ladder shows ten price levels either side of the last traded price, with the last price on the middle row.
Five columns, read from the outside in:
- BID QTY. The quantity resting on the buy side at that price.
- BUY. The same bid quantity drawn as a horizontal bar, with a lighter bar behind it showing the running total from the market outward, so you can see the shape of the book without reading numbers.
- PRICE. The price ladder itself, centered on the last price.
- SELL. The ask quantity drawn as a bar, mirroring the buy side.
- ASK QTY. The quantity resting on the sell side at that price.
Click any row to prefill a limit order in the order ticket. A row above the market prefills a buy limit at that price, a row below the market prefills a sell limit. Nothing is placed until you confirm in the ticket, so the ladder is a fast way to load a price without hunting for the limit field.
What depth is telling you is how much size stands between the current price and the next one. Thin quantity near the market means a modest order can push price through several levels; deep quantity means you can trade size without moving it much. The practical rule is a comparison, not a threshold: if the total quantity within a few levels of the market is smaller than the order you are about to send, expect your average fill to be worse than the price on the top row, and use a limit order instead of a market order. Resting size is also not a promise, because orders can be pulled the moment they are needed.
Reading the Trade Tape
The Trade Tape is the panel that answers “what actually happened”, as opposed to what you intended. It has two feeds and one filter.
- My Fills. Your own executions on this simulator, newest first. This is where you check the price you got against the price you clicked.
- Prints. The market’s own trade feed for the symbol. Use it to see whether activity is picking up or drying out before you commit to an entry.
- Current. A checkbox that filters the feed to the symbol on the chart. Leave it ticked when you are working one instrument, untick it when you are running several and want to see everything.
My Fills earns its space over time. If your market orders keep filling on the wrong side of the price you clicked, your real cost per round trip is higher than the spread on screen, and the fix is to work limit orders at a level rather than pressing market into a move. The same idea applied to a real broker statement is what the Slippage Auditor does, by re-pricing your fills against independent one minute market data.
The More Tools drawer
The chip row at the top of the order ticket holds shortcuts to the tools you use while sizing a trade: Size, R:R, Pip, Margin and SL. The last chip, More, opens a slide-out drawer holding CleaRank’s calculators and research tools, and the keyboard shortcut is T.
The drawer is not a link out of the simulator. It runs the tool beside your chart, reads the symbol and price you are already looking at, keeps those figures up to date while it is open, and never overwrites a value you typed yourself. Results can be sent into the order ticket, so a position size you just calculated does not have to be retyped. There is also a collapsible More Tools card row lower down the Trade tab with shortcuts to the Position Size Calculator, the Stop Loss Calculator, Fibonacci retracement and the Trade Journal.
Build a layout in four steps
- Start from Default. Open the Trade tab and press Reset Layout so you begin from a known arrangement rather than someone else’s experiment.
- Remove what you do not read. Close panels with the cross in their header. A panel you never look at still costs you screen space and attention.
- Add what the job needs. Use Add Panel to bring in the DOM Ladder and Pending Orders for working entries, or Positions and Trade Tape for managing what you hold, then arrange them with the move arrows.
- Save it under a name. Press Save As and name it after the job. Next time, pick it from the workspace selector instead of rebuilding it.
Frequently asked questions
What is the difference between Save and Save As?
Save writes the current arrangement back to the workspace you already have selected, so it overwrites that layout. Save As creates a new named workspace from what is on screen and leaves the original untouched. Use Save As the first time you build a layout, and Save for every tweak afterward.
I closed a panel by accident. Is it gone?
No. Closing a panel only removes it from the current arrangement. Open the Add Panel menu and pick it again, or press Reset Layout to restore the default set. Nothing is permanent until you press Save.
What is in the More Tools drawer?
CleaRank’s calculators and research tools, opened inside the simulator instead of in a separate tab. Each one reads the symbol and chart you already have on screen, keeps those figures up to date while the drawer is open, and can push its result back into the order ticket. The keyboard shortcut is T.
Does the DOM Ladder show real market depth?
No. The ladder is centered on the live price, but the quantity on each rung is generated by the simulator so you can practice reading a ladder and working orders at a price level. Do not read it as information about real resting orders.
How do I place an order from the ladder?
Click a price row. A row above the market prefills a buy limit at that price in the order ticket, a row below prefills a sell limit. The order is not sent until you confirm it in the ticket, so you can adjust the quantity or the brackets first.
What is the difference between My Fills and Prints?
My Fills lists your own executions on this simulator, so it answers what price you actually got. Prints is the market’s trade feed for the symbol, so it answers how active the market is right now. The Current checkbox filters either feed to the symbol on your chart.
Try it yourself
Open the simulator and build a layout around the way you actually trade.
Related articles
CleaRank tools are for education and analysis. Nothing in this guide is financial advice.