
Journal Analytics: Returns, Risk, Edge, and Discipline
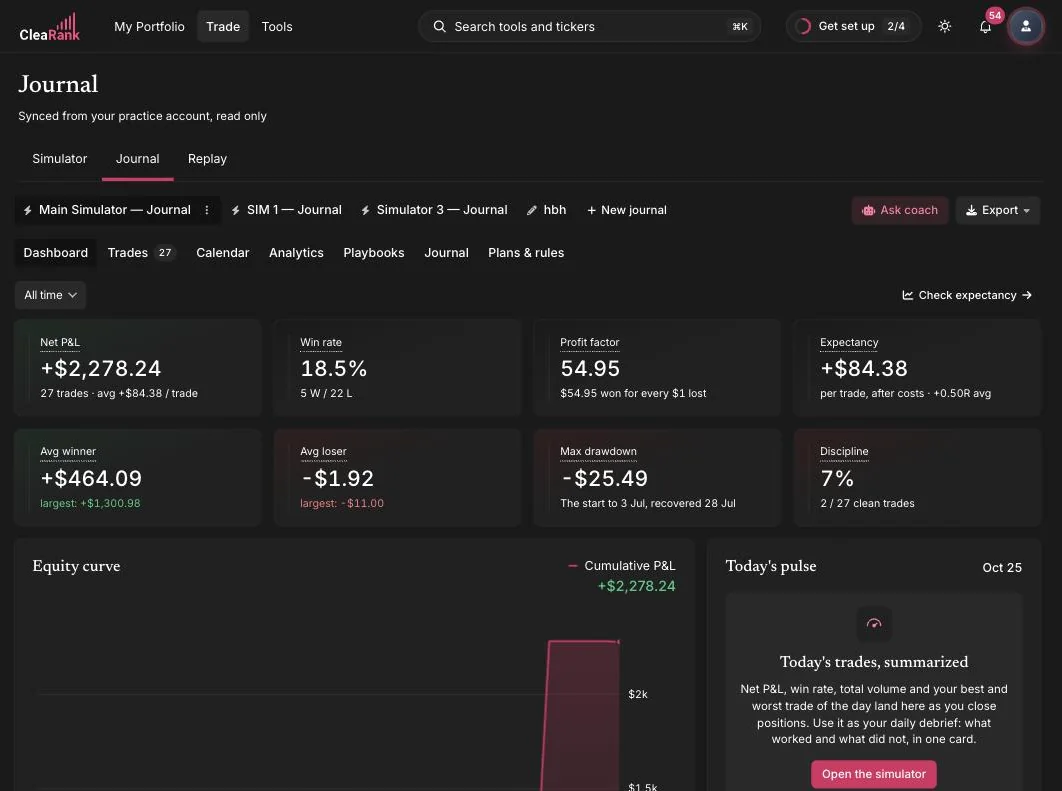
The Analytics tab in the CleaRank Trade Journal charts four things about your trading: how much you made, what it cost you in drawdown, where the money comes from, and whether you followed your own rules. Because every closed simulator trade mirrors into the journal automatically, fees and all, these fifteen charts fill in without manual entry. This page explains each chart and what to do with it.
The three filters apply to every chart
Above the sub-tabs sit three selectors and a Reset button. They are global: change one and all fifteen charts redraw together, so you never have to wonder whether two charts are looking at the same slice of history.
- DATE RANGE: All Time, 1 Year, 1 Month, 1 Week, or Today. Shorter windows are useful for checking whether a recent change to your process is working, but be careful: a one-week window on a swing strategy may contain three trades, and three trades cannot tell you anything.
- ASSET CLASS: All, Stocks, Forex, Crypto, Options, or Futures. Filtering here is the fastest way to find out whether one market is subsidizing another.
- SIDE: All, Long, or Short. A large gap between your long and short numbers usually means you have one real edge and one habit.
- Reset: returns all three to All.
Sample size decides how much of this you should believe. Under about 30 closed trades, treat every number as a hint rather than a measurement. Two of the charts refuse to draw at all below their minimum, which is a feature, not a fault.
Returns: did the account go up
Equity Curve
Your cumulative net profit and loss, trade by trade, after fees. What you want is a line that climbs in steps with shallow, short pullbacks. What you do not want is a line that makes all of its progress in one or two vertical jumps: that shape means your record depends on a couple of outliers, and a strategy that needs an outlier to be profitable is not yet a strategy. If one trade is doing all the work, filter it out with the date range and look at what is left.
Monthly Returns Heatmap
One tile per calendar month, shaded by net profit and loss in money, not in percent, with the amount printed on the tile. The pattern to look for is consistency: mostly green with occasional shallow red is a working process. Alternating deep green and deep red at similar magnitudes means your results are noise, even if the total is positive. A run of three or more red months is the point at which most traders should reduce size and go back to the Discipline sub-tab before changing the strategy.
Rolling 30-Trade Win Rate
The win rate of your most recent 30 trades, recalculated at every trade, plotted on a 0 to 100 scale. It needs at least 30 closed trades before it draws anything, because there is no first window to plot until then.
Do not judge this line against a fixed target. Win rate is only meaningful next to your payoff ratio: at a reward-to-risk of 1:1 you need to win more than 50 percent of the time to break even, at 1:2 you need 33 percent, and at 1:3 you need 25 percent. What matters here is the slope. A win rate sagging over the last 30 trades while your average winner has not grown is an early warning that the market has changed or that you have started taking marginal setups. The usual fix is to tighten entry criteria back to what your playbook actually says.
R-Multiple Distribution and Expectancy
R is the result of a trade divided by the money you initially risked on it, so a trade that risked 100 and made 250 is +2.5R. The chart sorts every trade that has an R value into seven buckets: below -2R, -2R to -1R, -1R to 0, 0 to 1R, 1R to 2R, 2R to 3R, and above +3R. Losing buckets are red, winning buckets are green.
A healthy shape has losses packed tightly into the -1R to 0 bucket and a visible tail on the right. That means your stops did their job and you occasionally let a winner run. Bars in the -2R and below -2R buckets are the single most diagnostic thing on this page: they mean stops were widened, moved, or ignored, because a trade you exit at your stop cannot lose more than 1R. If those buckets are populated, the fix is not a new strategy, it is honoring the stop you already set.
If the chart is empty it will say so. R can only be calculated on trades that have a stop-loss recorded, so trades saved without one are simply left out.
Risk: what it cost to get there
Drawdown Waterfall
Every peak-to-trough decline in your cumulative profit and loss, sorted largest first, up to ten bars labeled DD 1 through DD 10. DD 1 is your worst historical stretch in money.
Two things to read here. First, size: a drawdown of more than 20 percent of the account is the level at which most people abandon a plan, and prop firm evaluations typically fail you somewhere between 4 and 10 percent, so if you are practicing for one of those, compare DD 1 against that limit in the Prop Firm Auditor. Second, shape: if DD 1 is several times larger than DD 2, one episode broke your rules rather than your strategy failing. If DD 1 through DD 5 are all similar, that is your strategy’s normal cost of doing business and you should size for it.
Session Heatmap (Day x Hour)
A grid of day of week against hour of day, colored by net profit and loss, using your computer’s local time and showing only the days and hours you actually traded. Underneath, the best and worst cells are named outright, for example “Best: Tue at 15:00”.
A good pattern is concentration: two or three warm cells that line up with a session open you deliberately trade. A bad pattern is scatter, warm and cold cells spread evenly across the week, which means your results are not coming from timing at all and you should look at the Edge sub-tab instead. The action is narrow: if one hour is consistently and materially negative across many trades, stop trading it for a month and compare. This chart is available on every plan.
MAE / MFE Scatter
MAE is Maximum Adverse Excursion, the worst the trade went against you while it was open. MFE is Maximum Favorable Excursion, the best unrealized profit it showed before you closed it. Each trade is one dot: MAE on the horizontal axis, MFE on the vertical, green if the trade finished a winner and red if it finished a loser.
This is the chart that tells you where your stop and your target belong, and it does it in two readings.
- A wide MAE spread on winning trades means your winners routinely dip a long way against you before working. If your stop sits inside that spread you are being stopped out of trades that would have paid, and the fix is a wider stop with a smaller position so the money at risk stays the same. If instead the green dots all cluster at a small MAE, your stop is further away than it needs to be and you are risking more than the setup requires.
- High MFE with a small final profit is the other half. CleaRank’s own coaching puts it plainly: a high MFE with a tiny result means you are letting winners turn into scratches. If many dots sit high on the vertical axis but finished red or barely green, you are giving back open profit, and the fix is a partial exit or a trailing stop rather than a bigger target.
Excursion is recorded continuously while a position is open, which only happens on simulator trades. Manually logged and imported trades have no excursion history, so the chart will tell you there is no data rather than plotting a misleading half-sample. It needs at least two trades with both values, and it is available on every plan.
Win/Loss Streaks
How often runs of consecutive same-outcome trades happened, grouped by run length. A bar labeled “3 trades” with a height of 4 means four separate runs of three trades in a row finished the same way. Wins and losses are counted together, so read it as a measure of clustering rather than as a scoreboard.
Long runs are normal and are not evidence of anything by themselves: at a 40 percent win rate, a run of five losses shows up regularly. What matters is whether you can survive the longest bar. If your worst run multiplied by your risk per trade would put a serious dent in the account, your position size is too large, not your luck too bad. At 1 percent risk per trade, ten losses in a row is about a 10 percent drawdown, which is recoverable. At 5 percent risk it is fatal.
Edge: where the money actually comes from
Your Personal Edge
The banner at the top of the Edge sub-tab shows a single ratio and a sentence of interpretation. It appears once you have five or more closed trades. If at least three of your trades have a stop-loss recorded, the ratio is your average reward-to-risk. If not, it falls back to your average winner divided by your average loser, labeled “avg win vs avg loss (payoff ratio)”.
CleaRank’s own target is 1.5:1 or better paired with positive expectancy. Below that, the sentence tells you which lever to pull: win more often, or make winners larger relative to losers. The banner also protects you from a false reading. If your average loss is tiny, usually because near-breakeven exits leave only fees behind, the ratio inflates to something absurd like 200:1 and CleaRank says so directly and points you at expectancy instead. Treat any payoff ratio above about 20:1 as an artifact, not an edge.
Expectancy is the number to trust: your average result per trade after costs. It must be positive, and multiplying it by the number of trades you take in a month tells you what the month is worth. Use the Trade Expectancy calculator to test what happens when you change one input.
Top 20 Symbols by P&L
Your twenty biggest symbols ranked by the absolute size of their contribution, so the worst offenders appear alongside the best performers rather than being hidden at the bottom. Read the losers first. A single symbol responsible for a large share of your total losses is the cheapest fix available to you: stop trading it. A single symbol responsible for most of your profit is a warning of a different kind, because it means the record you are looking at is really the record of one instrument.
Setup Performance
A table of every setup you have tagged, with Trades, Win %, Avg R, and P&L. Trades with no setup assigned are grouped as Untagged.
Compare rows on Avg R rather than on P&L, because P&L is contaminated by how big you happened to size each trade. A setup with a positive Avg R over 20 or more trades has earned more size. A setup with a negative Avg R over 20 or more trades should be retired, not tweaked. Anything under about 20 trades is not yet evidence. If your Untagged row is the biggest row, the table cannot help you until you start assigning setups, which is what playbooks are for.
P&L by Asset Class
Net profit and loss per asset type. The useful question is not which bar is tallest but whether any bar is meaningfully negative. Traders very often carry one market purely out of interest while another one pays for it. If crypto has cost you money over 50 trades and stocks have made it, you have your answer and it does not require a strategy change.
P&L by Entry Hour
Twenty-four bars, one per hour, keyed to the hour you entered each trade in your computer’s local time. This is the simpler cousin of the session heatmap and it works on far fewer trades. Look for hours that are consistently negative across a reasonable number of trades rather than one hour that holds a single large loss. Because it uses local time, the labels move if you travel or change time zone.
Discipline: did you follow your own rules
Both charts on this sub-tab depend on you having written rules in the Plans & Rules tab. With no rules defined there is nothing to measure, and CleaRank deliberately shows no score rather than crediting you with a perfect one. Your simulator trades are scored against your rules too, and editing a rule re-scores your simulator history.
Discipline Score Over Time
A running score that starts at 100, loses 5 points for every trade that broke a rule, and recovers half a point for every clean trade, never going below 0 or above 100. It needs at least five trades to draw.
This is a momentum line, not an average, and that is the point: because breaking a rule costs ten times more than following one earns, the line falls fast and climbs slowly, which is roughly how trust works. A line recovering steadily from a dip is the shape you want after a bad week. A line grinding along the bottom means the rule set and your actual behavior have parted company, and the honest response is to rewrite the rule to something you will keep rather than to keep failing a rule you will not.
This line is not the same number as the Discipline tile on the journal dashboard. The tile is the share of all your closed trades that broke no rules, expressed as a percentage. Above 80 percent is healthy, 60 to 79 is a warning, and below 60 usually means you are over-trading or letting position size creep.
Rule Compliance Breakdown
One row per rule, each showing a compliance percentage and the count behind it, for example “16 violations across 25 trades” or “25 trades clean”. This is where a low overall discipline score becomes actionable, because it names the single rule doing the damage.
Fix one rule at a time, starting with the lowest percentage. In practice the stop-loss rule and the daily trade-count rule are the two that move the overall number most, and they are also the two that show up again in your R-multiple distribution and your drawdown waterfall. A rule at 100 percent compliance for months is either genuinely internalized or set too loosely to be a constraint.
Frequently asked questions
Why is my R-Multiple Distribution empty?
R is calculated from the distance between your entry and your stop, so a trade saved without a stop-loss has no R value and is left out. Add a stop-loss to the trade in the trade editor and it appears the next time you open the tab.
Why does the MAE / MFE Scatter say there is no data?
Adverse and favorable excursion are recorded continuously while a position is open, which only happens on simulator trades. Manually logged and imported trades have no excursion history, so they cannot be plotted.
Why does the Rolling 30-Trade Win Rate need 30 trades?
The chart plots the win rate of the trailing 30 trades at every point in your history. Until you have 30 closed trades there is no first window to draw.
Is the Discipline Score Over Time line the same as the Discipline tile?
No. The tile is the share of your closed trades that broke no rules, all time. The chart is a running score that starts at 100, drops 5 points per rule-breaking trade and recovers half a point per clean trade, so it shows momentum rather than a lifetime average.
Do the filters apply to all four sub-tabs?
Yes. Date range, asset class and side redraw every chart at once, and Reset returns all three to All.
Try it yourself
Open Analytics and start with the R-Multiple Distribution. It is the fastest read on whether your process is sound.
Related articles
CleaRank tools are for education and analysis. Nothing in this guide is financial advice.