
Simulator Performance Analytics
The Performance tab in the CleaRank Trading Simulator breaks your practice results into the numbers behind the profit total: equity curve, R-multiple histogram, session heatmap, profit factor, win rate, per-symbol results, and portfolio composition. Every figure on the tab is defined below, with what a good value looks like and what to do when yours is not.
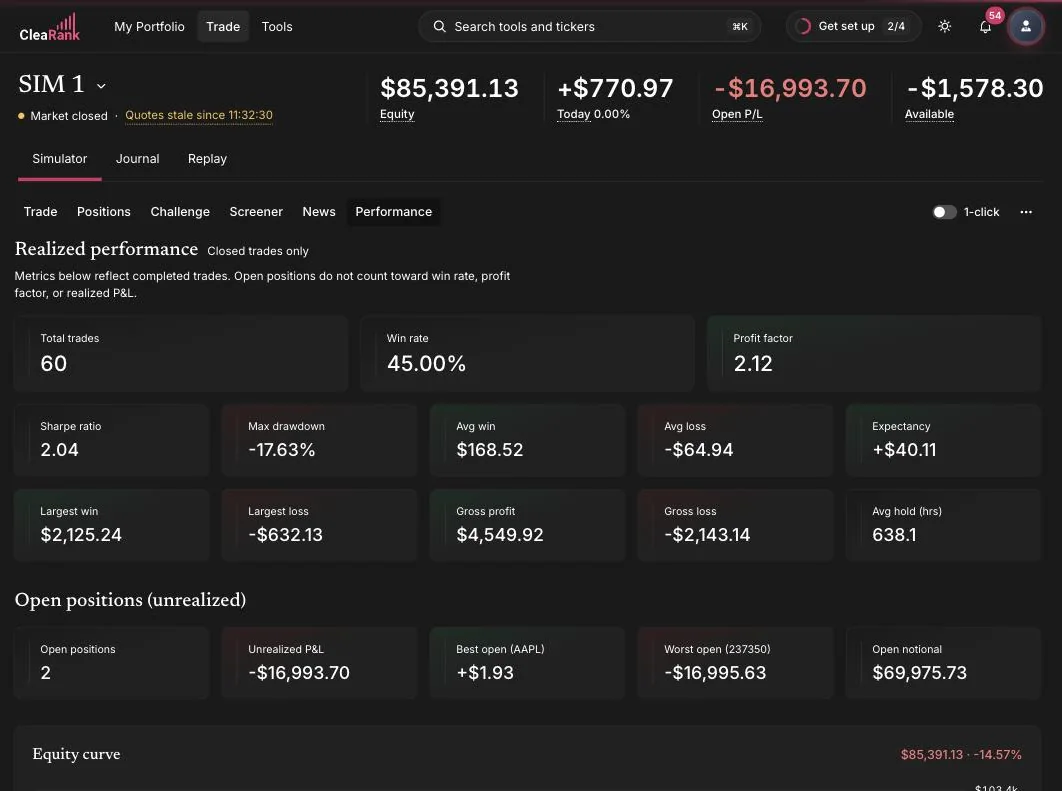
Closed trades only, and why that matters
An open losing position is not counted anywhere on this tab. That is honest accounting, and it is also the easiest way to flatter yourself, which is why the tab says so out loud. The header reads “Realized Performance (CLOSED TRADES ONLY)”, with the note “Metrics below reflect completed trades. Open positions do not count toward win rate, profit factor, or realized P&L.”
So a 90 percent win rate sitting next to three large open losers is not a 90 percent win rate. It is a record with the bad news postponed. Read the closed-trade figures together with the open-position figures further down this page, Open Notional and Worst Open in particular, before deciding the account is doing well.
Total Trades, Win Rate, and Profit Factor
Three tiles are highlighted at the top of the tab because they answer, in order, how much evidence you have, how often you are right, and whether being right has been worth more than being wrong.
Total Trades is the count of closed trades feeding every other number here, so it is really the confidence level on all of them. Below 20 closed trades, read the whole tab as direction rather than verdict. CleaRank enforces that in one place by hiding the Sharpe Ratio until you reach 20 closed trades. The fix for a thin sample is not a new strategy, it is more repetitions of the current one.
Win Rate is the share of closed trades that finished in profit. On its own it benchmarks nothing, and a win rate quoted without a payoff ratio beside it is marketing rather than analysis. What makes it readable is the breakeven win rate, which is 1 divided by (1 plus R), where R is your reward-to-risk ratio: 1:1 needs 50 percent, 1:2 needs 33 percent, 1:3 needs 25 percent. A 40 percent win rate at 1:3 is a good system. An 80 percent win rate at 1:0.2 is not, because the occasional loss is five times the size of a win. If your win rate sits below the breakeven rate for the way you actually trade, the fix is wider targets, tighter stops or better entries, and the Breakeven Win Rate Calculator shows which one closes the gap.
Profit Factor is the sum of your winning trades divided by the absolute size of the sum of your losing trades. Above 1.0 you are net profitable, and sustained readings of 1.5 or better mean a comfortable edge. Around 1.0 you are breaking even and paying costs for the privilege. Below 1.0 you are losing money, and the usual fix is to find the setups or symbols producing most of the gross loss and stop taking them. If you have no losing trades yet the tile shows N/A, because there is nothing to divide by.
Sharpe Ratio, and why yours will look high
This is the one number on the tab that will flatter you, and it helps to know exactly how before you quote it to anyone.
CleaRank treats each closed trade as one observation. It takes the average trade profit and loss, divides it by the standard deviation of trade profit and loss, and multiplies the result by the square root of 252, as if you had taken exactly one trade every trading day for a full year. The risk-free rate is not subtracted. In plain words, it measures how even your trade results are, not how large they are: two accounts with identical total profit will show very different figures if one got there steadily and the other got there with a single enormous win among many losses.
The annualization inflates the figure considerably. A modest per-trade ratio of about 0.32 shows on the tile as about 5.13. There is no published band for this figure, and inventing one would be dishonest, so read it as a rough consistency indicator on practice trades and compare it against your own earlier number rather than against a fund’s Sharpe. Rising over time means your results are becoming more even. Falling means a few trades are doing more and more of the work, and the fix is to standardize position size before you look at entries.
The tile stays hidden until you have at least 20 closed trades, showing “need 20+” until then, because the number is not statistically meaningful below that. Nothing fixes that except closing more trades.
Max Drawdown
Drawdown is what ends trading careers, far more often than a poor win rate does.
Max Drawdown is the largest peak-to-trough fall in your equity curve, measured from the highest point the account reached down to the lowest point it fell to afterward. In a portfolio context, a fall of 20 percent or deeper is where most people abandon a plan altogether, and prop firm evaluations typically cap drawdown somewhere between 4 and 10 percent, which is why the figure is worth watching even on practice trades.
If yours is climbing past the level you could sit through calmly, the fix is position size rather than entries. At 1 percent risk per trade, ten losses in a row is about a 10 percent drawdown, which is recoverable. At 5 percent risk per trade the same losing streak is not.
Avg Win, Avg Loss, and Expectancy
These three tiles are one idea in three pieces: what you make when you are right, what you pay when you are wrong, and what the pair is worth per trade once you weigh them by how often each happens.
Avg Win is the mean profit of your winning trades and Avg Loss the mean loss of your losing ones. Divide the first by the second and you have your payoff ratio, which is the number your win rate has to be read against. A payoff of 2.0 breaks even at a 33 percent win rate, 1.0 at 50 percent and 0.5 at 67 percent. If Avg Loss is bigger than Avg Win while your win rate sits near 50 percent, you are losing by arithmetic, and the fix is to stop closing winners early rather than to go hunting for new entries.
Expectancy is the average result per trade after costs, expressed in money. It must be positive. Multiply it by the number of trades you take in a month to see what the month is worth, which is the only honest way to judge whether the activity is paying for itself. If expectancy is negative, no amount of extra trading fixes it, more trades simply get you to the loss faster. The Trade Expectancy Calculator lets you test which lever, win rate, payoff or costs, turns it positive.
Gross Profit and Gross Loss
These two are where profit factor comes from, and reading them separately tells you something the single ratio hides.
Gross Profit is the sum of every winning trade. Gross Loss is the sum of every losing trade. Both are totals before the two are netted against each other, and Profit Factor is simply Gross Profit divided by the absolute value of Gross Loss. Above 1.0 you are net profitable, 1.5 or better is a comfortable edge, and below 1.0 you are losing money.
When the two figures sit close together, the edge is thin and one bad week can flip it. The useful action is not to trade more. It is to open the per-symbol breakdown further down this tab, find which symbols or setups contribute most of the gross loss, and stop taking them. Removing the worst contributor usually moves profit factor further than any change to your entries.
Largest Win and Largest Loss
These two tiles exist to test whether your record is a process or an accident.
Largest Win is your single best closed trade. If it is a large multiple of your Avg Win, the record depends on an outlier. Remove it mentally and check whether the account is still profitable without it. If it is not, you have one lucky trade and a losing strategy, and the fix is to judge the strategy on the trades that remain.
Largest Loss is your single worst closed trade. If it is more than roughly twice your Avg Loss, a stop was widened or skipped. That is a discipline problem, not a strategy problem, and no change to the setup will fix it. The fix is making the stop non-negotiable, which you can hold yourself to by writing it as a rule in the Trade Journal.
Avg Hold (hrs)
There is no good number here, only a matching number.
Avg Hold (hrs) is the mean time from entry to exit across your closed trades, in hours. What matters is whether it matches the strategy you intended to trade. An intraday plan showing an average hold measured in days means positions are being carried well past the plan. A swing plan showing an average of two hours means you are being shaken out before the idea has room to work. In both cases the number is not wrong, your behavior is drifting from the plan.
The diagnostic that pays is comparing hold time on winners against losers. If losers are held far longer than winners, you are cutting winners early and hoping on losers, which is the most common way a decent strategy produces a losing account. The fix is a written exit rule, decided before entry, rather than a new entry technique.
Open Notional, Best Open, and Worst Open
These three describe the part of the account the realized metrics deliberately ignore, which makes them the first place to look when the closed-trade numbers seem too good.
Open Notional is the market value of the positions you currently hold, quantity times price, before any leverage is applied. It is exposure, not risk: it tells you how much market you are carrying, not how much you can lose. Compare it against your account equity, then size so that the loss at your stops stays inside the standard 1 to 2 percent per trade band. At 1 percent risk per trade, ten consecutive losses is about a 10 percent drawdown and recoverable. At 5 percent it is not, and the fix is smaller size rather than a tighter stop on a position that needs room.
Best Open and Worst Open are the open positions with the largest unrealized gain and the largest unrealized loss right now. Neither counts toward win rate, profit factor or realized profit and loss, which is exactly why they are worth checking. A Worst Open larger than your Avg Loss means the position is already past the stop you would have set, and it will not appear in a single realized metric until you close it. The action is to decide, today, whether you would open that trade again at the current price. If you would not, close it.
Equity Curve
The shape of this line says more than the number it finishes on.
The equity curve plots your account value over time. A steady climb with shallow dips means a consistent process. A jagged line with deep valleys means the result depends on a handful of trades. A long flat stretch followed by one vertical move means you have one good trade and a lot of noise around it, and the honest reading is that you have not yet shown an edge.
Watch the behavior after losses in particular. Quick, controlled recoveries are the signature of stable risk. A deep valley followed by a violent recovery usually means size was increased to win the money back, which works until the one time it does not, and the fix is a fixed risk per trade that does not change with your mood.
Returns by Month
Read this one for repetition, not for the biggest cell.
Returns by Month shows realized profit and loss for each calendar month of the year, color-coded from loss to gain, with a total for the year. If one month carries the whole year, the record is one good month plus eleven flat ones, and that will not repeat on demand. A run of small positive months with contained negatives is the shape that compounds, even when the annual total looks less impressive than a single spectacular month.
If your calendar shows one huge month among a scatter of red, the useful question is what was different that month, in the market or in your behavior, and whether you can recognize those conditions again rather than trading through everything else while you wait for them.
R-Multiple Distribution
This is the chart that catches stop discipline, which makes it the most valuable thing on the tab.
R is a trade’s profit or loss divided by the initial risk on that trade. A trade that risked 100 and made 250 is +2.5R. One that lost exactly what it risked is -1R. Expressing results in R makes trades of different sizes directly comparable. The histogram sorts your closed trades into eight fixed buckets: below -3R, -3 to -2R, -2 to -1R, -1 to 0R, 0 to +1R, +1 to +2R, +2 to +3R, and above +3R.
The healthy shape is losses clustered tightly in the -1 to 0R bucket, with a meaningful tail of winners at +2R and beyond. Anything sitting in the -2R or -3R buckets means the stop was widened or ignored on those trades, and the fix is the stop, not the entry. No entry technique survives losses that are two and three times the size you planned for.
Session heatmap by hour
Most traders make their money in a few hours of the day and give it back in the rest, without ever noticing which is which.
The heatmap breaks your realized results down by hour of the day, one cell per hour, colored from loss to gain. The pattern is usually blunt: a couple of strong windows, often around a session open, and a long stretch of hours that mostly produce boredom trades. The action is equally blunt, stop trading the hours that lose. If that is hard to do by willpower alone, write it as a rule in the Trade Journal so the breach gets recorded when it happens.
Per-symbol breakdown
A result carried by one symbol is a result about that symbol, not about your process.
The symbol table shows realized results per instrument, with a toggle between your top ten and every symbol you have traded. Switch to the full list, because the tail is where the leaks are: most accounts have two or three instruments doing the work and a long list of one-off experiments that quietly cost money. If a single symbol produces most of the profit, your edge is specific to that symbol, and it is worth asking whether the same approach has ever worked anywhere else before assuming that it will.
Portfolio Composition
Position count is not diversification.
Portfolio Composition shows how your currently open positions are distributed. If most of the open exposure sits in one asset class or one name, you are making a single bet however many tickets you have written. Correlated positions behave as one position at exactly the moment it matters, so read this next to Open Notional: five names in the same sector at 1 percent risk each is closer to a 5 percent bet than to five separate 1 percent bets, and the fix is to spread the exposure or to cut the size on each.
Frequently asked questions
What is an R-multiple?
Profit or loss divided by the initial risk on the trade. Risking $100 and making $300 is +3R; losing the planned $100 is -1R. R-multiples make trades of different sizes comparable and expose whether stops are being honored. On trades where you did not record a stop, the histogram assumes risk equal to 1 percent of the entry notional, so those bars reflect an assumption rather than your real risk.
Why is my Sharpe Ratio showing “need 20+”?
The tile is hidden until the account has at least 20 closed trades, because below that the figure is not statistically meaningful. Close more trades and it appears on its own.
Why is my Sharpe Ratio so high?
Because it is annualized. Each closed trade is treated as one observation and the result is multiplied by the square root of 252, as if you took one trade every trading day for a year. A modest per-trade ratio of about 0.32 displays as about 5.13. Treat it as a rough consistency indicator on practice trades and compare it against your own earlier readings, not against a fund’s Sharpe.
What is a good profit factor?
Above 1.0 means gross profits exceed gross losses. Sustained readings above roughly 1.5 suggest a comfortable edge. Below 1.0 you are losing money. A high profit factor on a small sample means little, so let the sample grow first.
Why does my profit factor show N/A?
Profit factor divides gross profits by gross losses. With zero losing trades there is nothing to divide by, so the tab shows N/A until your history includes at least one loss.
Do these analytics include my manual journal trades?
The Performance tab covers the selected simulator account and its closed trades only. Journal-wide analytics, including manually logged and imported trades, live in the Trade Journal analytics.
Try it yourself
Close a few practice trades and watch your statistics take shape.
Related articles
CleaRank tools are for education and analysis. Nothing in this guide is financial advice.