
Portfolio Visualizer: Backtest Any Portfolio
CleaRank’s Portfolio Visualizer backtests any combination of tickers and weights against history. Add at least two assets, pick a period and a benchmark, and get a full analysis: returns, risk metrics, drawdown behavior, stress-era performance, and a Monte Carlo projection with goal probability.
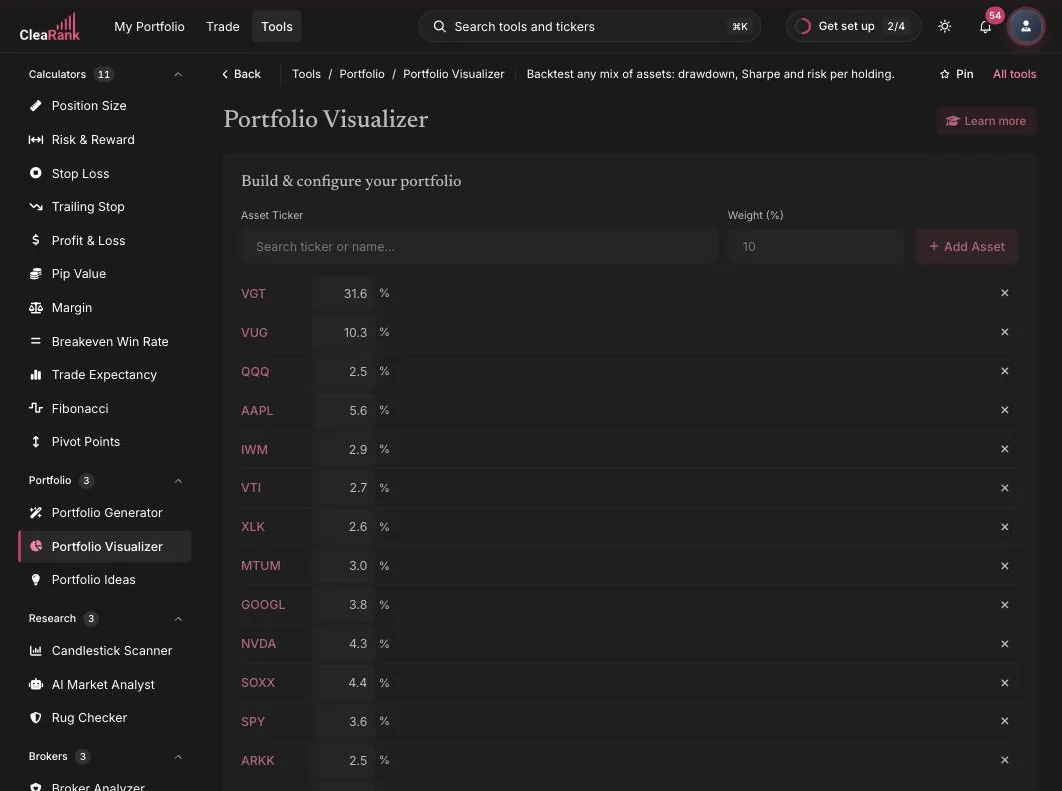
What you can test
You can mix asset classes freely: stocks, ETFs, crypto, and forex pairs can sit in the same portfolio. Each asset gets a weight in percent, and the Total Weight row keeps a running sum so you can see when the portfolio adds up to 100 percent. There is no fixed template; a two-ticker sanity check and a twelve-asset multi-class mix run through the same analysis.
Run a backtest
- Add your assets. Search by ticker or name in the Asset Ticker field, set a Weight (%), and click Add Asset. Repeat until you have at least two assets and the Total Weight reaches 100 percent.
- Set the initial investment. The Initial Investment ($) amount scales the results into dollar terms, for example 10,000.
- Choose the analysis period. Pick 1, 3, 5, or 10 years, or a custom period. How far back you can reach depends on your plan; the period selector shows the range yours covers.
- Pick a benchmark. The default is the S&P 500 (SPY), but you can benchmark against BTC or your own pick instead.
- Run the analysis. One click runs the full suite: performance chart, risk metrics, drawdown curves, correlation, stress eras, and Monte Carlo projection.
Reading the results
The headline metrics summarize the backtest. Each one is shown next to the same metric for your chosen benchmark over the identical window, which is the only fair comparison you can make.
Total return and CAGR
Total return is the whole gain or loss across the period, start to finish. CAGR is the single steady annual growth rate that would have taken your starting value to your ending value over the same stretch of time. It smooths a bumpy path into one number: a portfolio that gained 60 percent over five years has a CAGR of about 9.9 percent, not 12 percent, because each year’s growth compounds on the last.
What to do with it: compare your CAGR against the benchmark’s CAGR over the identical window. Never compare it against a number you remember from a different period, because a strong five-year stretch and a weak one describe different markets, not different portfolios.
Volatility
Volatility is the annualized standard deviation of returns, quoted in percent per year. It describes how widely the returns spread around their own average, which is why two portfolios with the same CAGR can feel completely different to hold.
What good looks like: there is no universal threshold, so judge it against a broad equity index over the same window rather than in the abstract. Lower volatility than the index with comparable return means the mix is doing real work. Higher volatility for the same return means you are being paid nothing for the extra swings, and the usual fix is to add assets that do not move together (check the correlation panel) or to shift weight toward the steadier holdings.
Max drawdown
Max drawdown is the deepest peak-to-trough fall on the compounded curve: the worst slide from a high-water mark down to the low that follows it, before any recovery.
What good looks like: a drawdown of 20 percent or worse is the level at which most investors actually abandon a plan, so treat it as a test of whether you could have held on, not just a statistic. Read it off the drawdown chart and ask honestly whether you would have kept going through that stretch. If the answer is no, the mix is too aggressive for you whatever the CAGR says, and trimming the holding that contributed most of the fall is more useful than reaching for a higher return.
Sharpe ratio
Sharpe measures how much return the portfolio earned for each unit of total volatility it put you through. Higher is better, because it means the same ride bought you more.
What good looks like over a multi-year window: under 1 is weak, 1 to 2 is solid, 2 to 3 is strong, and above 3 usually means a short sample or leverage rather than skill. Treat any Sharpe from a short window with caution, because small samples flatter the ratio easily. When Sharpe is weak, the lever is usually risk rather than return: cut the position contributing most of the volatility before reaching for a higher-return asset.
Sortino ratio
Sortino is a risk-adjusted return measure based on downside deviation, so only the moves against you count as risk. The upside swings that Sharpe penalizes are left out.
What good looks like: read it on the same scale as Sharpe (under 1 weak, 1 to 2 solid, 2 to 3 strong, above 3 usually a short sample or leverage), with the same caution about short samples. Sortino is normally higher than Sharpe. A large gap between the two means most of the volatility in that window was upside, which is not a problem to fix. Sortino is shown as unavailable when there was effectively no downside in the window, which tells you about that stretch of history rather than about an error.
Benchmark comparison
Every metric above sits next to your chosen benchmark so you can see whether the mix actually earned its complexity. If your portfolio trails the benchmark on return and beats it on nothing, the simpler holding was the better call.
Stress-era analysis
Where your tickers’ data covers them, the Visualizer replays your allocation through major historical market events so you can see how it would have held up under real stress, not just averages. If an asset in your portfolio did not exist during an era, that era is skipped explicitly rather than silently filled in, so you always know which stress results are grounded in real data.
Dropped tickers and data transparency
If a ticker cannot be included, for example because it lacks price history for your chosen period, the Visualizer tells you instead of quietly ignoring it. A visible notice lists any dropped tickers so the results you read always match the portfolio that was actually tested.
Dividends and fund costs
The price history behind the backtest is total-return adjusted, so dividends are included in every return and every risk metric on the page, treated as reinvested. You do not need to add them back by hand, and a dividend-paying holding is not being undercounted. Because that data is already net of fund costs, an expense ratio shown alongside a holding is informational context only: it is not subtracted from the results a second time.
Monte Carlo projection and goal probability
Beyond the historical backtest, the Visualizer runs a Monte Carlo simulation that projects a range of possible future paths for your portfolio. The projection and the goal probability come from the same simulation run, so the two numbers always agree: if you set a target amount, you see the estimated probability of reaching it over your horizon alongside the projected range of outcomes.
For a quick summary of the tool without signing in, see the Portfolio Visualizer page on clearank.com.
Frequently asked questions
What does the Sharpe ratio tell me?
It measures how much return the portfolio earned for each unit of total volatility. Over a multi-year window, under 1 is weak, 1 to 2 is solid, 2 to 3 is strong, and above 3 usually means a short sample or leverage rather than skill. Compare it against the benchmark’s Sharpe over the identical period, and treat any ratio from a short window with caution.
How is CAGR different from total return?
Total return is the whole gain across the period. CAGR is the single steady annual growth rate that would have taken your starting value to your ending value over that same stretch of time, so it smooths a bumpy path into one number. A portfolio that gained 60 percent over five years has a CAGR of about 9.9 percent, not 12 percent, because each year’s growth compounds on the last.
Why was one of my tickers dropped from the analysis?
Usually because it lacks price history covering your chosen period. The Visualizer reports dropped tickers visibly rather than silently excluding them, so check the notice above the results and shorten the period or swap the asset.
Can I benchmark against something other than the S&P 500?
Yes. SPY is the default, but you can choose BTC or search for your own benchmark when configuring the analysis.
Does the backtest include dividends?
Yes. The price history behind every backtest is total-return adjusted, so dividends are included in every return and every risk metric, treated as reinvested. Because that data is already net of fund costs, an expense ratio shown next to a holding is informational and is not subtracted a second time.
How far back can I backtest?
Your plan sets the ceiling, and the period selector shows the range yours covers. If you need a longer window than your plan covers, shorten the analysis period or upgrade from the Billing tab in your account settings.
Try it yourself
Backtest your portfolio idea in one click.
Related articles
CleaRank tools are for education and analysis. Nothing in this guide is financial advice.