
How the Margin Calculator works
The CleaRank Margin Calculator tells you how much of your account a broker would set aside as collateral for a trade, based on your position size and leverage. Use it before you plan a position so you know exactly how much buying power a trade consumes, across forex, crypto, commodities, indices, and stocks.
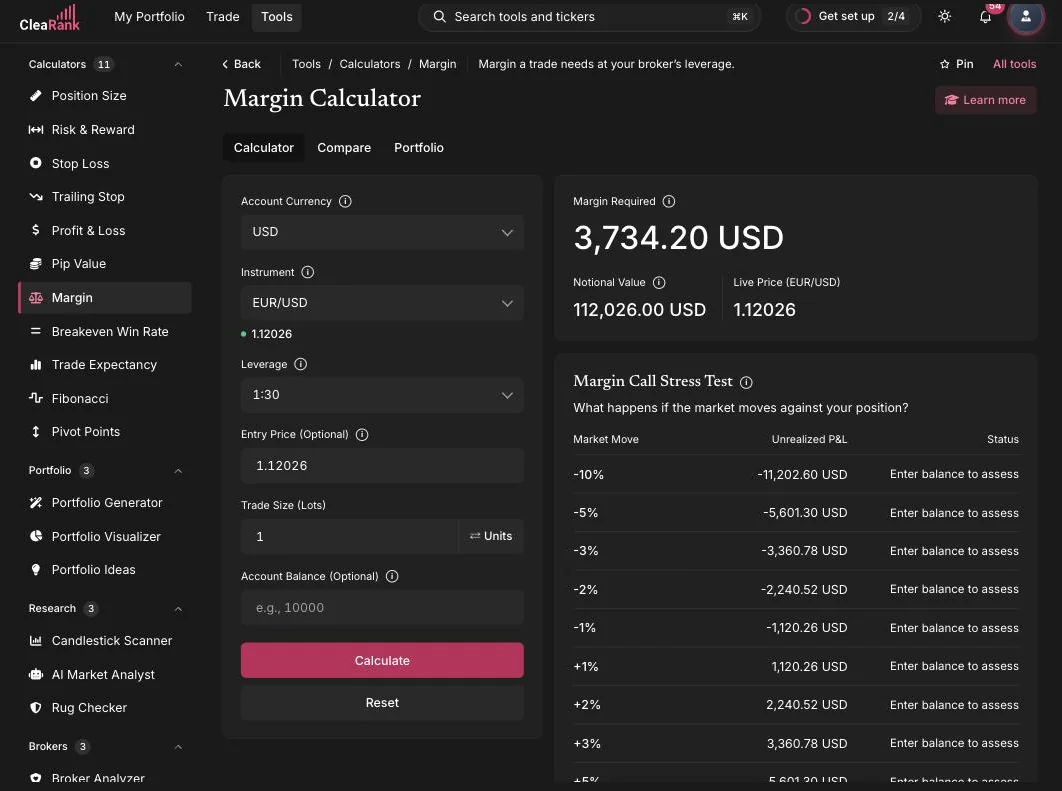
How much margin a position ties up
Required margin is the slice of your account that gets locked while a leveraged position is open. The idea is simple: work out the full notional value of the position (how much the trade actually controls), then divide it by your leverage. Finally, the result is converted into your account currency at the current exchange rate.
In plain words: margin = position value divided by leverage, converted to your account currency. Higher leverage means less margin locked per trade, but the position value, and therefore the risk, stays the same.
Worked example. You buy 1 standard lot of EUR/USD (100,000 EUR) at 1.15300 with 1:30 leverage and a USD account. Notional value = 100,000 x 1.15300 = 115,300 USD. Required margin = 115,300 / 30 = 3,843.33 USD.
Leverage, contract size, and the numbers you enter
- Account Currency. The currency your account is denominated in (USD in the screenshot). The margin result is always converted into this currency.
- Instrument. Pick the pair or asset, for example EUR/USD. The calculator shows the live market rate under the field (1.15310 in the screenshot).
- Leverage. Your broker’s leverage ratio, such as 1:30. This is the divisor in the margin formula.
- Trade Size (Lots). Position size in lots, with a Units toggle if you prefer to enter raw units instead.
- Entry Price and Account Balance (optional). Override the live price with your planned entry, and add your balance to see margin in context of your account.
- Calculate. Click Calculate (or press Enter) to see your margin requirement. Reset clears the form.
Beyond the main Calculator tab, the tool has a Compare tab for putting margin requirements side by side at different leverage levels, and a Portfolio tab for totaling margin across several planned positions at once.
Multi-currency and JPY quote pairs
The calculator is multi-currency aware. When the pair’s base or quote currency is not your account currency, it converts at the live rate rather than assuming a 1:1 relationship. This matters most on JPY quote pairs, where prices are quoted in the hundreds.
JPY example. 1 lot of USD/JPY controls 100,000 USD (the base currency), so with a USD account at 1:30 leverage the margin is 100,000 / 30 = 3,333.33 USD, regardless of the yen price. A naive calculator that multiplies by the 150-plus yen quote would report a wildly inflated number.
Margin Call Stress Test
The margin figure tells you how much of your account is locked up. It does not answer the question that actually decides the trade: at what adverse move does this position stop being yours to manage. That is the job of the Margin Call Stress Test card, which appears with your results under the subtitle “What happens if the market moves against your position?” It runs the exact position you entered through ten price moves, so you can see the failure point before you place the trade rather than after.
The table has four columns.
- Market Move. Ten rows: five against you at -10%, -5%, -3%, -2% and -1%, and five in your favor at +1%, +2%, +3%, +5% and +10%. The negative rows are the ones that matter. The positive rows are there so you can see how fast the same leverage works in the other direction.
- Unrealized P&L. What that move would be worth in your account currency at the size you entered, before any fees.
- Margin Level. Your equity as a percentage of the margin the position is using. Higher is safer. It falls as losses eat your equity, and once equity turns negative the figure goes negative too.
- Status. The plain-language verdict for that row. The possible values are Safe, Watch, Danger, Margin Call, Stop Out, and N/A when there is not enough information to judge.
Always fill in Account Balance. The Margin Level column only appears when that optional field has a value. Leave it blank and every row of the Status column reads Enter balance to assess, which strips the card of the only thing you came for. The stress test is the reason the field exists.
Here is the card for the worked example above: 1 standard lot of EUR/USD at 1.15300, 1:30 leverage, 3,843.33 USD of margin, held in a 10,000 USD account.
| Market Move | Unrealized P&L | Margin Level | Status |
|---|---|---|---|
| -10% | -11,530 USD | -39.8% | Stop Out |
| -5% | -5,765 USD | 110.2% | Danger |
| -3% | -3,459 USD | 170.2% | Danger |
| -2% | -2,306 USD | 200.2% | Watch |
| -1% | -1,153 USD | 230.2% | Watch |
| +1% | +1,153 USD | 290.2% | Safe |
| +2% | +2,306 USD | 320.2% | Safe |
| +3% | +3,459 USD | 350.2% | Safe |
| +5% | +5,765 USD | 410.2% | Safe |
| +10% | +11,530 USD | 560.2% | Safe |
Read it from the top. A 10% move against this position wipes out more than the 10,000 USD balance, so equity goes negative and the margin level prints as a negative number. That is the row that tells you the trade is capable of taking the whole account. Shrink the balance or raise the lot size and the same table starts printing Danger, Margin Call and Stop Out on far smaller moves, which is exactly the signal you are looking for.
What to do when the status turns bad
The test that matters is not whether an extreme move breaks you, it is whether an ordinary move breaks you. Look up the instrument’s normal daily range, find the closest row, and read its status.
- If a move you would consider ordinary for that instrument already reads Danger, Margin Call or Stop Out, the position is too big for the account. That is a sizing problem, not a timing problem, and no amount of chart work fixes it.
- Fix it in this order: cut the size first (halving the lots halves the P&L on every row), then cut the leverage if your broker offers a lower tier, then add balance if the first two are not options.
- Moving your stop further away makes this worse, not better. A wider stop leaves you exposed to more of the adverse move before you are out, so more rows in the table become reachable.
- A useful bar to hold yourself to: a full normal day’s move against you should still read Safe. If it does not, size down until it does.
Margin call and stop-out levels vary by broker and by account type. Values around 100 percent for a margin call and around 50 percent for a stop out are common, and the statuses in the table above are illustrated on that basis, but they are not universal and they are not a promise. Your broker may warn you earlier, close you out later, or apply different levels to different account types. Check the actual levels in your own broker’s terms, because that is the number that decides whether you get a warning or an automatic close.
The cards that sit alongside it
Three related cards appear with the same set of results and are worth reading together with the stress test.
- Margin Usage gauge. The share of your account the required margin represents: under about 20 percent reads Safe, up to about 50 percent reads Moderate, and above that reads High Risk, where the fix is a smaller position rather than a bigger account.
- Volatility card. Includes a Margin Call Distance figure telling you how far price has to move before the margin call, which is the stress test compressed into a single number.
- Over-Leveraged warning. Appears when your size relative to balance and volatility is extreme, and it is a hard stop signal rather than a suggestion.
When to check margin before you size up
- Before placing a leveraged trade, to confirm you have enough free margin.
- When comparing brokers or leverage tiers, using the Compare tab.
- When planning several positions at once, to see total margin in the Portfolio tab.
- Together with the Position Size Calculator: size the trade by risk first, then verify the margin it needs.
Like every CleaRank calculator, it supports Save Scenario (up to 20, reloadable from the Load menu), PDF and CSV export, a Learn More panel, and light and dark mode. See the Calculators overview for the full shared feature list.
Save as Favorite
Most traders run the same handful of setups over and over: one pair, one leverage tier, one or two familiar lot sizes. Retyping them is wasted effort. After a calculation, the results actions row gives you three buttons: Export PDF Report, Export CSV and Save as Favorite. Save as Favorite pins the setup you just ran so you can bring it back later without entering it again.
The calculator also keeps a rolling history of your recent calculations, capped at the last 10, with a control to clear it. That is enough to compare what you just ran against the two or three variations you tried before it, without recalculating any of them.
Favorites and history live in your browser, not your account. They are per-device and per-browser, they will not follow you to your phone, and clearing site data deletes them. Save Scenario and Load Scenario are separate, the shared scenario system the other calculators use: reach for Save as Favorite for the setups you reuse daily, and Save Scenario when you want a named scenario you keep alongside your other calculator work.
Frequently asked questions
How do I calculate margin for a forex trade?
Multiply your position size by the current price to get the notional value, then divide by your leverage. Example: 1 lot of EUR/USD (100,000 EUR) at 1.15300 is 115,300 USD notional; at 1:30 leverage the required margin is 115,300 / 30 = 3,843.33 USD. The CleaRank Margin Calculator does this automatically with live rates.
What does 1:30 leverage mean?
For every 1 unit of margin you post, you control 30 units of position value. At 1:30, a 115,300 USD position requires 3,843.33 USD of margin. Leverage reduces the collateral locked, not the risk: profit and loss are still based on the full position value.
How much margin do I need to trade 1 lot of EUR/USD?
It depends on the price and your leverage. At 1.15300 with 1:30 leverage, about 3,843 USD. At 1:100 leverage the same position needs about 1,153 USD. Enter your own leverage in the calculator to get the exact figure at the live rate.
Why is my margin different for USD/JPY?
Because margin is based on the base currency of the pair. 1 lot of USD/JPY controls 100,000 USD, so in a USD account the margin is simply 100,000 divided by your leverage. The quote price in yen only matters if your account is not in USD, in which case the calculator converts at the live rate.
Why does the stress test not show a Margin Level column?
Because you did not enter an account balance. Margin Level is your equity as a percentage of the margin the position is using, and equity cannot be worked out without a balance, so the column is hidden and every row in the Status column reads Enter balance to assess. Fill in the optional Account Balance field and the column appears with a status on each row.
Try it yourself
Check the margin on your next trade in seconds.
Related articles
CleaRank tools are for education and analysis. Nothing in this guide is financial advice.