
How the Fibonacci Calculator works
The CleaRank Fibonacci Calculator plots retracement and extension levels for any symbol from a swing high and swing low. It can find the swing points for you from live market prices on your chosen timeframe, or take manual prices, and inside the trading simulator the levels can be drawn directly on the chart.
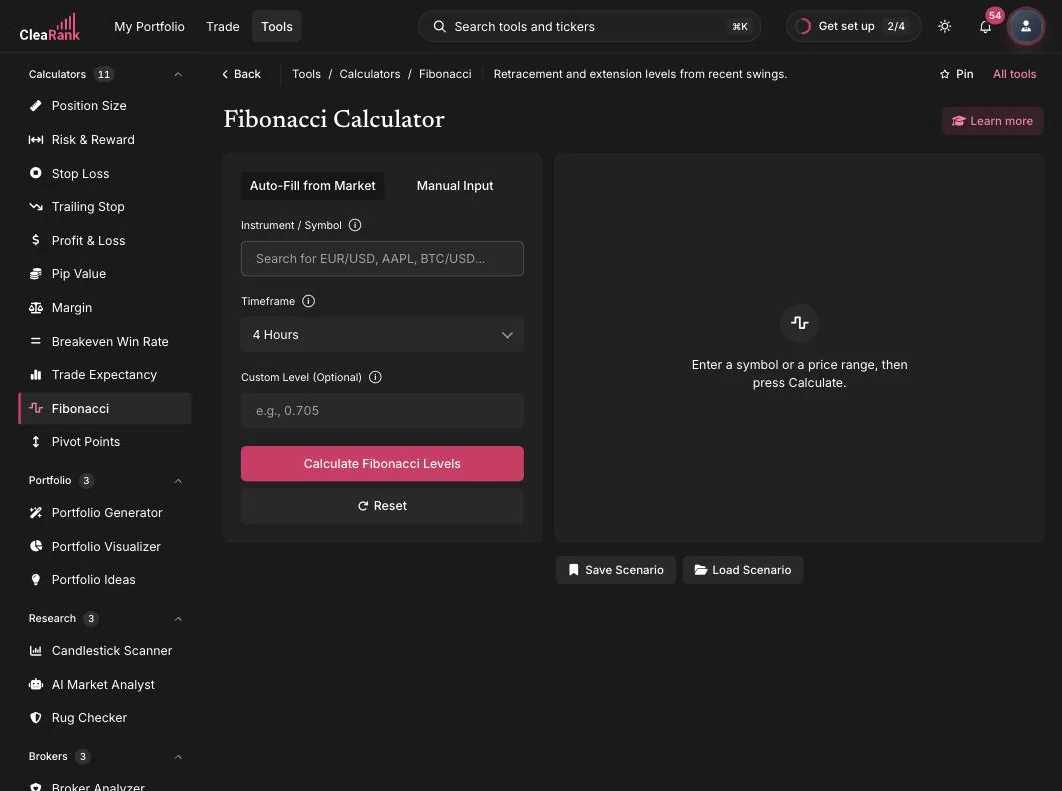
Where the retracement and extension levels fall
Fibonacci retracements mark how far a pullback has traveled relative to the previous move. In plain words: take the distance from swing low to swing high, multiply it by each Fibonacci ratio (23.6%, 38.2%, 50%, 61.8%, 78.6%), and measure that far back from the swing extreme. Extensions project beyond the move (127.2%, 161.8% and further) and are typically used for profit targets once price resumes the trend.
Worked example. Swing low 1.1000, swing high 1.1500, so the move is 0.0500. Retracements from the high: 38.2% = 1.1500 – (0.0500 x 0.382) = 1.1309; 50% = 1.1250; 61.8% = 1.1191. The 161.8% extension projects to 1.1000 + (0.0500 x 1.618) = 1.1809.
Swing high, swing low, and direction
- Choose the mode. Auto-Fill from Market finds recent swing highs and lows for you; Manual Input lets you type the exact high and low you want to measure.
- Instrument / Symbol. Search anything from EUR/USD to AAPL to BTC/USD.
- Timeframe. In auto mode, the timeframe (4 Hours in the screenshot) controls which swing structure the calculator reads. Larger timeframes give levels that more traders are watching.
- Custom Level (optional). Add a non-standard ratio such as 0.705 if your method uses one; it is calculated alongside the standard set.
- Calculate Fibonacci Levels. The output is the full ladder of retracement and extension prices for the move, plus CleaRank Financial AI trade setup commentary on the levels.
- Save or load scenarios. Save Scenario and Load Scenario buttons sit under the results, storing up to 20 setups per tool.
Draw on chart in the simulator
Open the Fibonacci tool from inside the Trading Simulator and you can send the finished ladder straight onto the live candlestick chart with Draw on chart. The levels land on the exact symbol and swing you analyzed, which beats eyeballing prices between two windows. From there you can set entries near a retracement and targets at an extension in the order ticket.
When Fibonacci levels help you plan an entry
- After a strong directional move, to map where a pullback might find support or resistance before continuing.
- To set profit targets with extensions when a trend resumes.
- To sanity-check confluence: a 61.8% retracement that lines up with a pivot level is more interesting than either alone.
Frequently asked questions
How do I calculate Fibonacci retracement levels?
Subtract the swing low from the swing high to get the move, multiply by the ratio, and subtract from the high (for an up move). Example: low 1.1000, high 1.1500; the 61.8% level is 1.1500 – (0.0500 x 0.618) = 1.1191. The calculator does the whole ladder at once.
What are the most important Fibonacci levels?
Most traders watch 38.2%, 50%, and 61.8% for retracements, with 78.6% as the deep pullback level, and 127.2% and 161.8% as common extension targets. The calculator gives you all of them, and you can add a custom ratio like 0.705.
Where do the swing high and low come from?
In Auto-Fill from Market mode, the calculator reads them from live market prices for your symbol and timeframe. In Manual Input mode you type the exact prices, useful when you want to measure a specific historical move.
Can I draw the levels on a chart?
Yes. Inside the CleaRank trading simulator, use Draw on chart to overlay the calculated retracement and extension lines on the live candlestick chart for the same symbol.
Try it yourself
Map the pullback before the market makes it.
Related articles
CleaRank tools are for education and analysis. Nothing in this guide is financial advice.