
How the Trailing Stop Calculator works
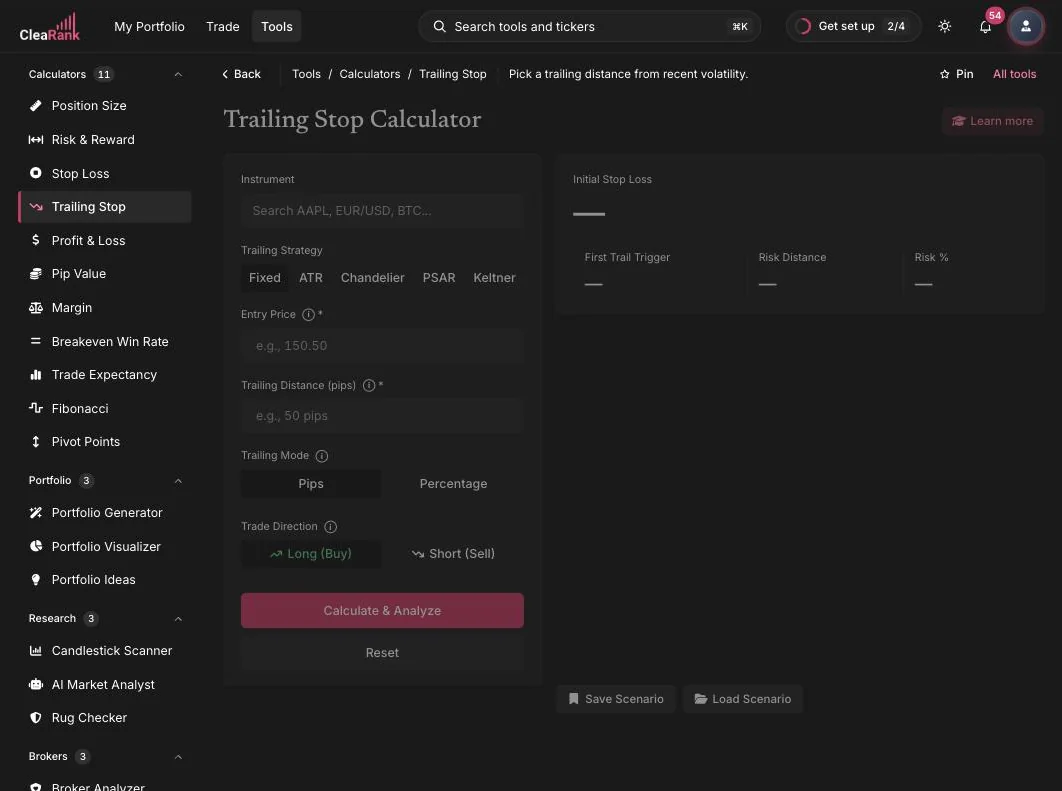
The CleaRank Trailing Stop Calculator models how a trailing stop would behave on your trade before you commit to one. Pick a strategy (Fixed, ATR, Chandelier, PSAR, or Keltner), a distance in pips or percent, and a direction, and it analyzes how the stop would follow price and where it would likely exit.
Open the Trailing Stop Calculator
How far behind price a trailing stop should sit
A trailing stop is a stop loss that follows price when the trade moves in your favor and freezes when it moves against you. In plain words: for a long, the stop always sits the chosen distance below the highest price seen since entry; it ratchets up, never down. The trade exits when price pulls back by the trailing distance. The calculator analyzes that behavior for your chosen distance and strategy, so you can see whether it locks profits or just gets shaken out early.
Worked example. Long EUR/USD from 1.1500 with a fixed 50-pip trail. At entry the stop is 1.1450. Price climbs to 1.1600, so the stop ratchets to 1.1550. Price then pulls back 50 pips to 1.1550 and the position exits, locking in +50 pips. Had you used a 20-pip trail, the first ordinary wiggle would likely have closed the trade near breakeven instead.
The five trailing strategies
- Fixed: a constant distance in pips or percent. Predictable and easy to reason about.
- ATR: the distance is a multiple of the Average True Range, widening in volatile conditions and tightening in calm ones.
- Chandelier: trails from the highest high (for longs) by an ATR multiple, a classic trend-following exit.
- PSAR: follows the Parabolic SAR indicator, accelerating the stop as the trend extends.
- Keltner: uses Keltner Channel boundaries, an EMA-centered volatility envelope, as the trailing line.
Entry, trail distance, and the strategy you pick
- Instrument. Search AAPL, EUR/USD, BTC, or any supported symbol and live market context fills in around it.
- Trailing Strategy. Choose Fixed, ATR, Chandelier, PSAR, or Keltner from the chips.
- Entry Price and Trailing Distance. Your entry (e.g., 150.50) and how far the stop trails (e.g., 50 pips).
- Trailing Mode. Express the distance in Pips or as a Percentage of price.
- Trade Direction. Long (Buy) trails below price; Short (Sell) trails above.
- Calculate & Analyze. The analysis shows how the stop would have followed price with your settings. Save Scenario and the Load menu keep up to 20 configurations, and the Learn More About Trailing Stops panel covers the theory.
When trailing beats a fixed stop
- Before switching a winning position from a fixed stop to a trail, to pick a distance that survives normal pullbacks.
- When comparing strategies: an ATR or Chandelier trail often outlasts a tight fixed trail in choppy markets.
- Before using the Trailing Stop order type in the simulator order ticket, so the distance you enter there is informed rather than guessed.
A public version of this tool is also available at clearank.com/tools/trailing-stop-calculator/. In the dashboard, the Trail chip above the simulator chart opens it with the chart symbol prefilled.
Frequently asked questions
How does a trailing stop work?
It follows price at a set distance when the trade moves in your favor and stays put when price moves against you. A long from 1.1500 with a 50-pip trail starts with a stop at 1.1450; if price reaches 1.1600 the stop rises to 1.1550, and a 50-pip pullback exits the trade with the gain locked in.
How far should my trailing stop be?
Wider than the instrument’s normal pullbacks, otherwise routine noise closes good trades. Volatility-based strategies like ATR, Chandelier, and Keltner set the distance from how the market actually moves; the calculator lets you test each on your entry before deciding.
What is a chandelier stop?
A trailing method that hangs the stop a multiple of ATR below the highest high since entry (for longs). It gives trends room while ratcheting up as new highs print, and it is one of the five strategies the calculator can model.
Should I trail in pips or percent?
Pips suit forex, where tick sizes are uniform; percent adapts across price levels and works naturally for stocks and crypto. The calculator’s Trailing Mode toggle lets you model both and compare the behavior.
Try it yourself
Find a trail that locks profit without choking the trade.
Related articles
CleaRank tools are for education and analysis. Nothing in this guide is financial advice.