
Journal Dashboard
The Dashboard is the first tab the CleaRank Trade Journal opens on, and it summarizes your recent trading on one screen. Closed simulator trades land here automatically with real fill prices, size, fees, and net result, so the numbers fill in without manual entry. This page explains the Performance at a Glance cards, the window filter, Today’s Pulse, hot and cold symbols, coach flags, and the equity curve.
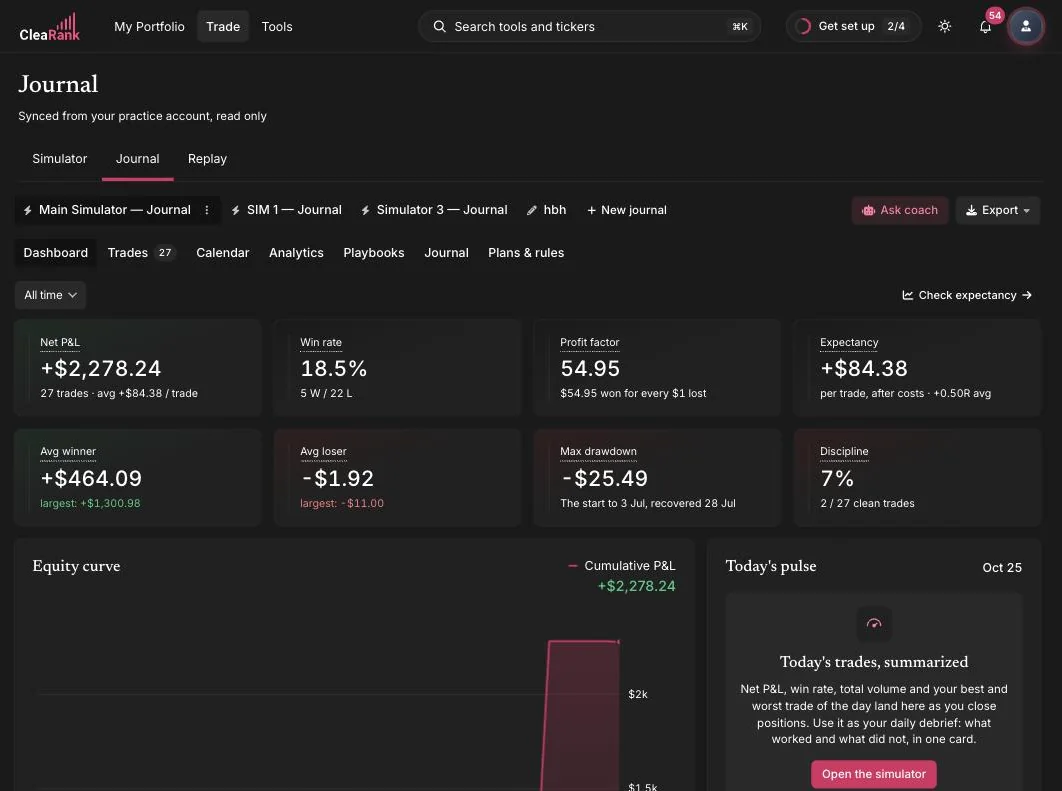
Performance at a Glance
The top row is eight cards under the heading Performance at a Glance, with a WINDOW selector beside it offering All time, Today, Last 7 days, Last 30 days, Last 90 days, and Year to date. Every card obeys the window, so comparing your last 30 days against all time is a single click.
Next to the window sits a Check expectancy button. It hands your current statistics to the Trade Expectancy calculator so you can ask what happens if your win rate slips five points or your average winner grows, without retyping anything.
NET P&L
Your total result for the window, after fees, with a sub-line showing the trade count and the average per trade. There is no good or bad number here in isolation, which is exactly why the sub-line matters: a healthy total built on four trades is not evidence of anything. Read this card together with the trade count and treat anything under roughly 30 trades as a preview rather than a verdict.
WIN RATE
The share of closed trades that finished positive, with the win and loss counts underneath. Win rate on its own tells you nothing, and any benchmark quoted for it without a payoff ratio is noise. What it has to beat is your breakeven win rate, which is 1 divided by (1 plus your reward-to-risk). At 1:1 you need better than 50 percent. At 1:2 you need 33 percent. At 1:3 you need 25 percent. If your win rate sits below the breakeven rate for the reward-to-risk you actually take, you are losing money no matter how good the percentage looks. The Breakeven Win Rate calculator does that arithmetic.
PROFIT FACTOR
Gross wins divided by gross losses, labeled as such on the card. Above 1.0 you are net profitable. 1.5 or better is a comfortable edge and can survive a bad stretch. Below 1.0 you are losing money, and the fix is usually the size of the average loss rather than the win rate, because cutting your worst losses moves the denominator faster than winning more often moves the numerator. When you have not had a losing trade yet the card shows an infinity symbol, which is a sign of a small sample, not of skill.
EXPECTANCY
Your average result per trade after costs. It has to be positive, and once it is, it is the most useful number on the page: multiply it by the trades you normally take in a month and you have a realistic expectation for the month. A negative expectancy with a positive net profit and loss means one large winner is carrying you, and that is worth knowing before you scale up.
AVG WINNER
The mean of your profitable trades, with your largest single winner underneath. Compare the average against the largest. If the largest is many times the average, your record leans on outliers, so check the equity curve for a single step that does all the work.
AVG LOSER
The mean of your losing trades, with your largest single loss underneath. Divide AVG WINNER by AVG LOSER and you have your payoff ratio; 1.5 to 1 or better is what to aim for. Two warning shapes live here. A largest loss far bigger than the average loss means a stop was widened or ignored on at least one trade. An average loss that is only a dollar or two usually means you are scratching trades at breakeven and the number is really just fees, which inflates the payoff ratio into something meaningless.
MAX DRAWDOWN
The largest peak-to-trough fall in your cumulative profit and loss for the window, labeled peak-to-trough on the card. The question is not whether the number is large but whether you would have kept trading through it. A fall of 20 percent or more of the account is roughly where most people abandon a plan, and prop firm evaluations typically fail you somewhere between 4 and 10 percent, so if you are practicing for one, compare this figure against that limit in the Prop Firm Auditor. If it is bigger than you are comfortable with, the lever is position size, not strategy selection.
DISCIPLINE
The share of your closed trades that broke none of your own rules, with the clean count over the total underneath. Above 80 percent is healthy. Between 60 and 79 is a warning. Below 60 usually means you are over-trading or letting position size creep, and the honest fix is fewer trades rather than better ones.
If you have not written any rules yet, the card shows a dash and a prompt to set some, because an empty rule set is not the same as a perfect score. Rules live in the Plans & Rules tab and are described in Goals and Trading Rules. They are scored against your mirrored simulator trades too, so the number covers your practice history and not just what you typed in by hand.
If you read only two cards, read Expectancy and Discipline. One says whether the strategy pays, the other says whether you are actually running it.
Today’s Pulse
A single card for the current day, headed with the date. It collects the day’s net profit and loss, win rate, total volume, and best and worst trade as you close positions, and it links straight into the simulator. Until you close something it explains what will appear there.
Use it as the end-of-session debrief. The pairing that matters is the trade count against the day’s result: a bad day made of one oversized loss and a bad day made of eleven small ones are different problems with different fixes, and only one of them is about the market.
Hot & Cold Symbols
Two short lists covering the past 30 days, headed HOT and COLD, each symbol showing its contribution and, in brackets, how many trades produced it.
Read the trade count before the money. One symbol at the top of HOT on a single trade is luck. The same symbol at the top on twelve trades is a specialism worth more size. On the COLD side, a symbol that keeps reappearing across several trades is the cheapest improvement available to you, because you can simply stop trading it and keep everything else the same.
Setup Performance
A compact table of your tagged strategies with the columns SETUP, TRADES, WIN %, AVG R, and P&L. Trades with no setup assigned collect in an Untagged row.
Compare rows on AVG R rather than on P&L, because P&L is distorted by how large you happened to size each trade while R is not. A setup with a positive average R across 20 or more trades has earned more size; a setup with a negative average R across 20 or more trades should be retired rather than tuned. If Untagged is your biggest row, this table cannot help you yet, and playbooks and setups is where you fix that.
Coach Flags
A card headed Coach Flags with the subtitle Insights and patterns, holding short automatic observations about your recent behavior, each with a title, the evidence behind it and a suggested response. Two examples of what they look like:
- Time-of-Day Slump. “Morning 33 percent vs Afternoon 13 percent. You perform worse in the afternoon. Consider taking fewer trades then.”
- Loss Streak Alert. “9 consecutive losses at worst. Step back. Review your plan. Consider a day off.”
Flags are pattern spotting on a small sample, so treat them as questions rather than conclusions. The right move is to take the flag to the matching chart in Journal Analytics, where the session heatmap and the win and loss streak chart will tell you whether the pattern survives more data.
Equity Curve
Your cumulative net profit and loss over the window, with the total repeated in the card header. What you want is a line that climbs in steps with shallow pullbacks. What should worry you is a line that makes all of its progress in one or two vertical jumps, because that means the record depends on a couple of outliers rather than on a repeatable process. The fuller version of this chart, with a monthly heatmap and a drawdown breakdown beside it, is in the Analytics tab.
Recent Trades
The last handful of closed trades, each row showing the symbol and its asset type, the side, the date, and the net result. A View all link takes you to the full Trades tab.
This is the sanity check on everything above it. If a row here looks wrong, the numbers on the cards are wrong too, and the place to correct a manually logged trade is the trade editor described in Logging Trades. Mirrored simulator trades cannot be edited by design, which is what keeps the statistics honest.
Where to go next
The Dashboard tells you what happened. When a card raises a question, the answer is one tab across in Journal Analytics, which breaks the same history into Returns, Risk, Edge and Discipline across fifteen charts. A weak profit factor sends you to the R-multiple distribution. A large max drawdown sends you to the drawdown waterfall. A low discipline score sends you to the rule compliance breakdown, which names the single rule doing the damage.
Frequently asked questions
Do I have to log my simulator trades to see them here?
No. Every trade you close in the Trading Simulator is mirrored into your journal automatically with its real prices, size, fees and result. The dashboard cards include those trades from the moment they close.
Why does my Discipline card show a dash?
Because you have not defined any trading rules yet. An empty rule set is deliberately not scored as 100 percent. Add rules in the Plans and Rules tab and the card starts counting from the next time you open the page.
Why is my Profit Factor showing an infinity symbol?
You have had no losing trades in the selected window, so there is nothing to divide by. It is a small-sample artifact rather than a measure of skill, and it resolves the first time a trade closes negative.
Does the window filter change every card?
Yes. All time, Today, Last 7 days, Last 30 days, Last 90 days and Year to date apply to all eight Performance at a Glance cards at once.
What is the difference between this tab and the Analytics tab?
The Dashboard is a summary built for a daily glance: eight headline numbers plus a few cards that point at problems. Analytics is the investigation, with fifteen charts split across Returns, Risk, Edge and Discipline and its own date, asset class and side filters.
Try it yourself
Set the window to Last 30 days and read Expectancy and Discipline first.
Related articles
CleaRank tools are for education and analysis. Nothing in this guide is financial advice.