
How the Candlestick Pattern Scanner works
CleaRank’s Candlestick Scanner scans any ticker for classic candlestick formations, from single-candle signals such as the Doji and the Hammer to three-candle reversals such as the Morning Star, labels each match with the published reliability rating for that pattern type, and gives you a chart preview plus exportable reports. Inside the Trading Simulator it goes further: it reads the exact bars on your chart and marks detected patterns directly on it.
Open the Candlestick Pattern Scanner
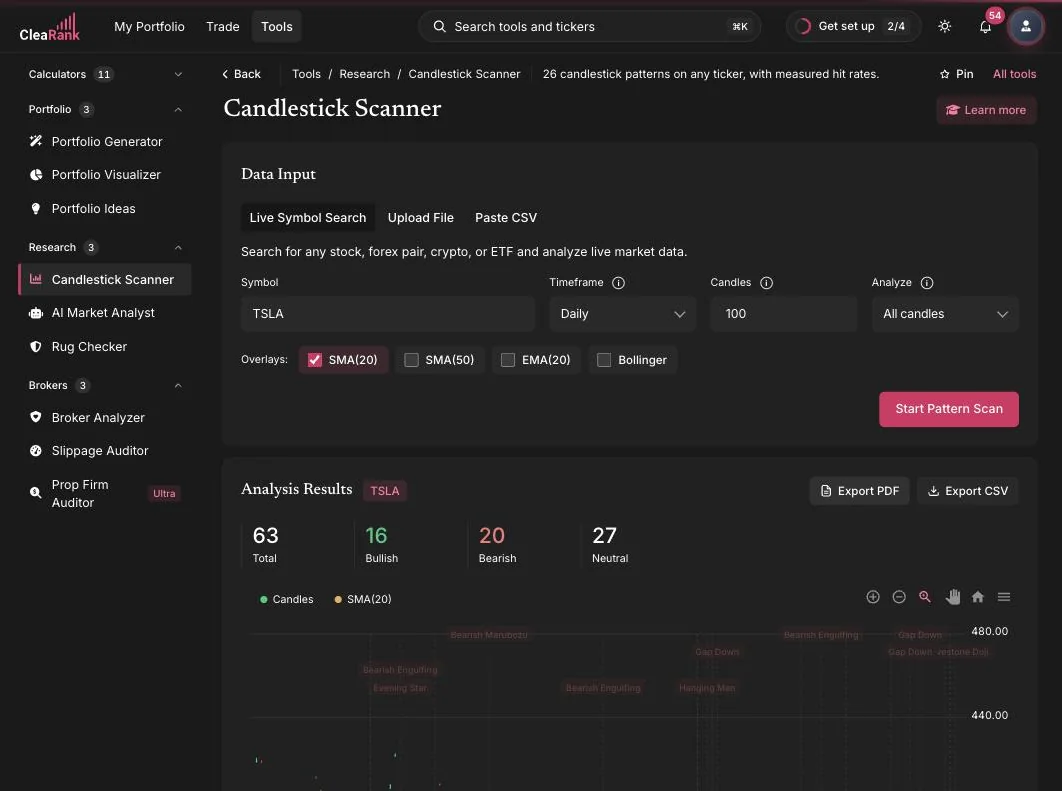
What it scans
Candlestick patterns are recurring bar formations that traders read as clues about shifting supply and demand. The scanner examines a window of candles (100 by default) on your chosen timeframe and reports the classic patterns it finds. At least 3 candles are needed for a scan to run, and the Analyze selector lets you scan all candles or narrow the analysis to a recent window.
Detection is plain geometry on the candles. The scanner compares each candle’s body size, its total range, and the length of its upper and lower wicks: a Doji is a candle whose body is under a tenth of its range, and a Hammer needs a lower wick at least twice the size of the body with almost no upper wick. Volume is not used anywhere in detection, so a pattern that forms on thin volume and the same pattern on heavy volume score identically. Confirming a pattern against volume is on you.
Each match is labeled with a reliability percentage, and this is the number most often misread: the percentage is a published historical-tendency rating for the pattern type, not a confidence score for this particular occurrence. It is taken from a fixed reference table, not calculated from the candles on your chart, so the same pattern always shows the same number. A Hammer always reads 65 percent, a Bullish Engulfing 72 percent, a Morning Star 75 percent, Three White Soldiers 78 percent, and a Doji 50 percent. The rating says nothing about how clean this particular example is, and it is not a probability that your trade will work.
The only banding on that number is the color of the reliability bar: 70 percent and above is green, 55 to 69 is amber, and below 55 is red. The chart marks at most the 20 highest-rated patterns so the view stays readable, while the card list below the chart shows every pattern found. The explanation on each card is written by CleaRank Financial AI and never changes the number.
Which patterns it flags
These are the formations a live scan can flag, grouped by how many candles each one takes to form:
- Single candle: Doji, Hammer, Shooting Star, Spinning Top, Bullish Marubozu, and Bearish Marubozu.
- Two candles: Bullish Engulfing, Bearish Engulfing, Piercing Line, and Dark Cloud Cover.
- Three candles: Morning Star, Evening Star, Three White Soldiers, and Three Black Crows.
Marubozu and Engulfing each come in a bullish and a bearish form, which is why both appear twice in that list. The reference material inside the tool describes further formations that a scan does not flag, including Dragonfly and Gravestone Doji, Hanging Man, Inverted Hammer, Bullish and Bearish Harami, Tweezer Top and Tweezer Bottom, gap ups and gap downs, and Three Inside Up and Three Inside Down. Those entries are there to learn from, so if you trade one of them you will need to spot it yourself.
Run a scan
- Choose your data source. The Data Input section offers three tabs: Live Symbol Search for any stock, forex pair, crypto, or ETF; Upload File; or Paste CSV for your own bar data.
- Pick the symbol. Search by ticker, for example AAPL, EUR/USD, or BTC/USD.
- Set the timeframe and depth. Choose a timeframe such as Daily and how many candles to analyze (100 by default).
- Choose what to analyze. Leave the Analyze selector on All candles for a full sweep, or narrow it.
- Add overlays if you want context. Optional overlays include SMA(20), SMA(50), EMA(20), and Bollinger bands, so detected patterns appear against trend context.
- Start the scan. Click Start Pattern Scan and review the pattern cards and chart preview. Reports are exportable.
Scanning inside the simulator
When you run a pattern scan from the Trading Simulator, the scanner reads the exact bars already drawn on your chart, so nothing extra is loaded and there is no wait, and it marks detected patterns directly on the chart.
Learning the patterns
The Learn More About Candlestick Patterns panel at the bottom of the tool explains the formations the scanner looks for, so you can move from reading the scanner’s output to recognizing patterns yourself. If you want a primer before signing in, the Candlestick Pattern Scanner page on clearank.com is a good place to start.
Frequently asked questions
Can I scan my own price data?
Yes. Alongside Live Symbol Search, the Data Input section accepts an uploaded file or pasted CSV, so you can scan bar data from any source.
Which markets does the scanner cover?
Any stock, forex pair, crypto, or ETF available through live symbol search, on your selected timeframe and candle depth.
Which patterns does a scan actually flag?
Doji, Hammer, Shooting Star, Spinning Top, Bullish Marubozu, and Bearish Marubozu on a single candle; Bullish Engulfing, Bearish Engulfing, Piercing Line, and Dark Cloud Cover across two candles; and Morning Star, Evening Star, Three White Soldiers, and Three Black Crows across three. Other formations described in the tool’s reference material, such as Harami, Tweezers, Hanging Man, and Inverted Hammer, are there to learn from and are not flagged by a scan.
What does the reliability percentage mean?
The percentage is a published historical-tendency rating for the pattern type, not a confidence score for this particular occurrence. It is taken from a fixed reference table rather than calculated from the candles on your chart, so a Hammer always reads 65 percent and a Doji always 50 percent, however clean or messy the example. Volume is not part of the reading either. Use it as a reminder of which formations have historically carried more weight, not as a probability for your trade.
Can I see detected patterns on my simulator chart?
Yes. Run the scan from inside the Trading Simulator and detected patterns are marked directly on the chart bars you are watching. The chart marks the 20 highest-rated patterns, and the card list below it shows every pattern found.
Try it yourself
Scan any ticker for patterns in seconds.
Related articles
CleaRank tools are for education and analysis. Nothing in this guide is financial advice.