
How the Risk & Reward Calculator works
The CleaRank Risk Reward Calculator turns three prices, entry, stop, and target, into a risk-to-reward ratio you can see at a glance. It plans trades in R-multiples, supports multiple take-profit targets, and shows the whole setup on a visual bar so lopsided trades are obvious before you take them.
Open the Risk & Reward Calculator
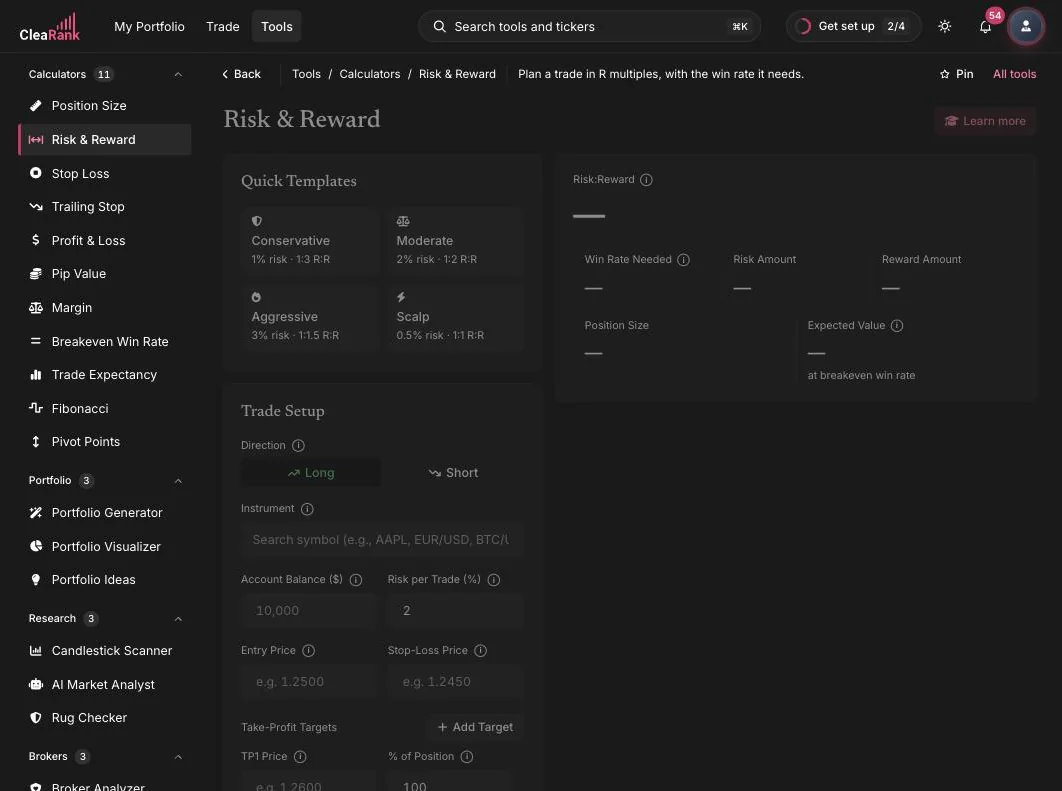
How much you stand to make for what you risk
Risk is the distance from your entry to your stop-loss. Reward is the distance from your entry to your take-profit target. The ratio between them is your R:R. In plain words: R:R = (target minus entry) divided by (entry minus stop) for a long trade, with the differences flipped for a short. A 1:2 ratio means every unit of risk buys two units of potential reward, so one winner pays for two losers.
Worked example. Long at 1.2500 with a stop at 1.2450 and a target at 1.2600. Risk = 1.2500 – 1.2450 = 50 pips. Reward = 1.2600 – 1.2500 = 100 pips. R:R = 100 / 50 = 1:2. On a 10,000 USD account risking 2% (200 USD), the target pays 400 USD, a 2R winner.
Entry, stop, and target
- Pick a Quick Template (optional). Conservative (1% risk, 1:3 R:R), Moderate (2%, 1:2), Aggressive (3%, 1:1.5), or Scalp (0.5%, 1:1). Templates prefill the risk settings; you can adjust anything afterward.
- Direction and Instrument. Choose Long or Short, then search a symbol (AAPL, EUR/USD, BTC/USD and so on).
- Account Balance and Risk per Trade (%). These translate the ratio into actual money at risk and money at target.
- Entry Price and Stop-Loss Price. The two prices that define 1R, your unit of risk.
- Take-Profit Targets. Enter TP1 with a % of Position, and click Add Target for scaled exits, for example 50% off at 1:1 and the rest at 1:3. The calculator shows the blended ratio.
- Result. The R:R ratio with a visual bar comparing the risk and reward legs, plus win-rate sensitivity so you can see what hit rate the setup needs.
Thinking in R-multiples
Once risk is defined, every outcome can be measured in R: a trade that makes twice its risk is +2R, a full stop-out is -1R. This normalizes results across instruments and position sizes, and it is how the simulator’s Performance tab buckets your closed trades in its R-multiple histogram. Planning trades here in R keeps your journal statistics meaningful later.
There is also a free public version of this tool at clearank.com/tools/risk-reward-calculator/ if you want to run a quick ratio without opening the dashboard.
When a risk-reward check saves a trade
- Before entry, to reject setups where the target does not justify the stop distance.
- When planning scaled exits across multiple take-profit levels.
- Together with the Breakeven Win Rate Calculator: your R:R determines the minimum win rate the strategy needs.
- From the R:R chip above the simulator chart, prefilled with the chart symbol and live price.
Frequently asked questions
How do I calculate risk reward ratio?
Divide the distance from entry to target by the distance from entry to stop. Example: entry 1.2500, stop 1.2450, target 1.2600 gives 100 pips of reward against 50 pips of risk, a 1:2 risk-to-reward ratio.
What is a good risk to reward ratio?
It depends on your win rate. 1:2 or better is a common target because it stays profitable even below a 50% win rate: at 1:2 you break even at about 33%. High-win-rate scalping styles can work at 1:1, but they leave far less room for error.
What is an R-multiple?
Your result measured in units of initial risk. If you risked 200 USD and made 400 USD, that is +2R; a full stop-out is -1R. R-multiples make trades comparable across different instruments and position sizes.
Can I plan multiple take-profit targets?
Yes. Use Add Target to define several take-profit levels, each with its own percent of the position. The calculator computes the blended risk-to-reward for the whole exit plan, not just the first target.
Try it yourself
See the shape of the trade before you take it.
Related articles
CleaRank tools are for education and analysis. Nothing in this guide is financial advice.