
How the Trade Expectancy Calculator works
The CleaRank Trade Expectancy Calculator tells you what your strategy earns or loses per trade on average, from just three numbers: win rate, average win, and average loss. It adds profit factor, a risk gauge, and a Monte Carlo distribution so you can see whether your edge is statistically real or a lucky streak.
Open the Trade Expectancy Calculator
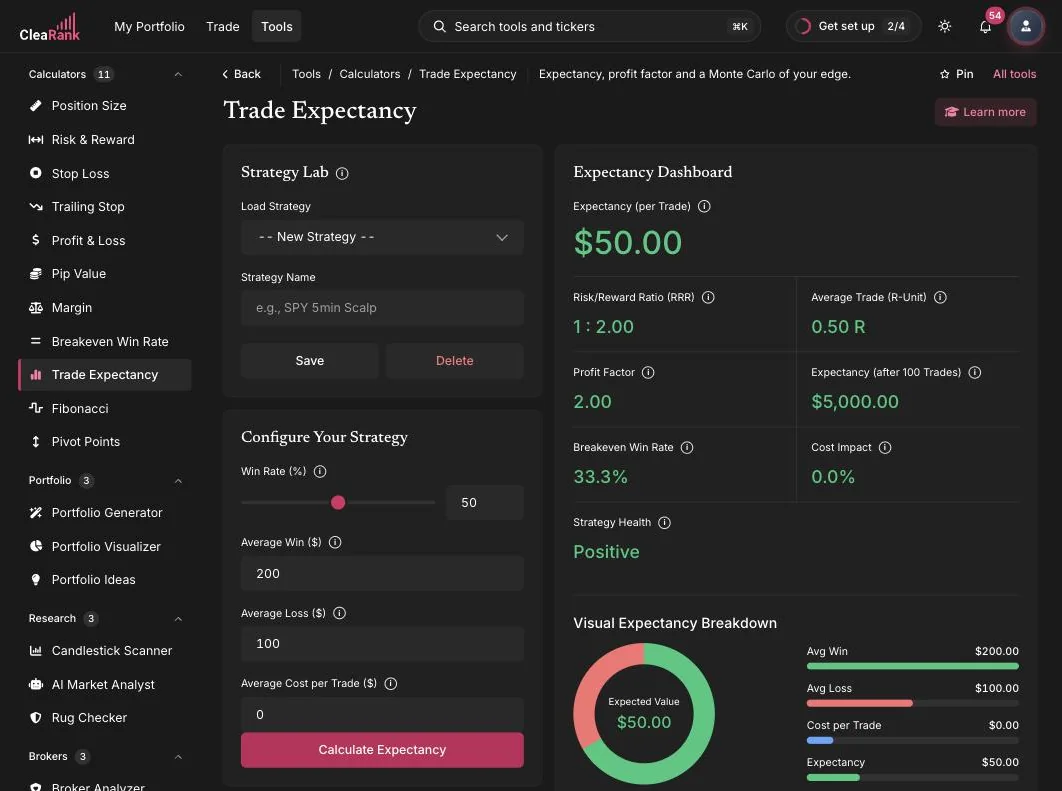
What your strategy earns per trade on average
Expectancy is the average outcome of one trade if you ran your strategy forever. In plain words: expectancy = (win rate x average win) minus (loss rate x average loss) minus average cost per trade. A positive number means the strategy makes money over time; a negative number means no amount of discipline saves it as-is.
Worked example. Win rate 50%, average win 200 USD, average loss 100 USD, no costs. Expectancy = (0.50 x 200) – (0.50 x 100) = 100 – 50 = +50 USD per trade. Over 100 trades that is about 5,000 USD. Profit factor = gross wins / gross losses = 100 / 50 = 2.0.
Win rate, average win, and average loss
- Save Scenario and Load Scenario. Name and store the current inputs with Save Scenario (for example, SPY 5min Scalp), then bring any of them back later from the Load Scenario menu.
- Win Rate (%). Set it with the slider or type it. Use your real historical figure from your journal, not a hope.
- Average Win ($) and Average Loss ($). The mean size of your winners and losers in money terms (200 and 100 in the screenshot).
- Average Cost per Trade ($). Commissions, spread, and slippage per trade, so the expectancy is net of expenses.
- Calculate Expectancy. The analysis returns your per-trade expectancy, profit factor, a risk gauge for how fragile the edge is, and a Monte Carlo distribution showing the range of outcomes across simulated trade sequences.
How many scenarios you can keep. Scenarios are saved per calculator, so the ones you save here belong to the Trade Expectancy Calculator and reload from the Load Scenario menu on this same tool. Each tool holds up to 20 saved scenarios, and saving a twenty-first drops the oldest.
Why the Monte Carlo view matters
Two traders with identical expectancy can live very different lives: the order in which wins and losses arrive determines drawdowns. The Monte Carlo simulation reshuffles your trade outcomes many times and shows the distribution of resulting equity paths, so you can see whether a bad-but-normal sequence would be tolerable or ruinous. If the pessimistic tail of the distribution is unacceptable, reduce risk per trade before changing anything else.
When to run expectancy on a strategy
- After 30 or more logged trades, to check whether the strategy has a real edge. Your Trade Journal analytics provide the win rate and averages to plug in.
- Before scaling up size: positive expectancy with a fat losing tail is a warning, not a green light.
- To compare strategy variants side by side: store each version with Save Scenario, then bring them back one at a time from the Load Scenario menu.
- Together with the Breakeven Win Rate Calculator, which shows the minimum win rate your ratio requires; expectancy shows what you earn above that threshold.
A public version is also available at clearank.com/tools/trade-expectancy-calculator/. In the dashboard you also get PDF and CSV export (all 11 CleaRank calculators export to both formats), the Learn More panel, cross-tool deep links, and the Expect chip inside the simulator.
Frequently asked questions
How do I calculate trade expectancy?
Multiply your win rate by your average win, subtract your loss rate times your average loss, then subtract average costs. Example: 50% win rate, 200 USD average win, 100 USD average loss gives (0.5 x 200) – (0.5 x 100) = +50 USD per trade.
What is a good trade expectancy?
Any reliably positive number after costs is workable; what matters is expectancy relative to risk and how many trades you take. An edge of +50 USD per trade at 20 trades a month compounds very differently from the same edge at 2 trades a month. Judge it with the Monte Carlo distribution, not the single average.
What is profit factor?
Gross winnings divided by gross losses. A profit factor of 2.0 means you made 2 USD for every 1 USD lost. Above 1.0 is profitable; well above 1.5 is generally considered healthy, though costs and sample size matter.
What does the Monte Carlo simulation show?
It reshuffles your trade outcomes into many simulated sequences and charts the distribution of results. This reveals drawdown risk and whether your edge survives unlucky orderings, something a single expectancy number hides.
Can I save my inputs and come back to them?
Yes. Use Save Scenario to store the current inputs under a name, and Load Scenario to bring one back. Scenarios are saved per calculator, and each tool keeps up to 20 of them.
Try it yourself
Find out if your edge is real before you scale it.
Related articles
CleaRank tools are for education and analysis. Nothing in this guide is financial advice.