
How the Breakeven Win Rate Calculator works
The CleaRank Breakeven Win Rate Calculator tells you what percentage of your trades must win for your strategy to break even. It works from your entry, stop, and target prices, and it includes fees, swaps, and slippage in the calculation.
Open the Breakeven Win Rate Calculator
The win rate a payoff ratio needs to break even
Breakeven win rate follows directly from your risk-to-reward ratio. In plain words: breakeven win rate = risk divided by (risk plus reward). If you make 2 units on winners and lose 1 unit on losers, you need wins 1 time out of every 3, about 33.3%. Costs shift the math against you: every trade pays spread and fees whether it wins or loses, so the real breakeven rate is always a little higher than the clean formula suggests. This calculator does the honest, after-cost version.
Worked example. Entry 1.2500, stop 1.2450 (50 pips risk), take-profit 1.2600 (100 pips reward). Breakeven win rate = 50 / (50 + 100) = 33.3%. At a 1:1 ratio it is 50%, and at 1:3 it drops to 25%. Add costs equal to 2 pips per trade and each figure rises slightly, because winners pay out less and losers cost more.
Payoff ratio, costs, and the win rate they demand
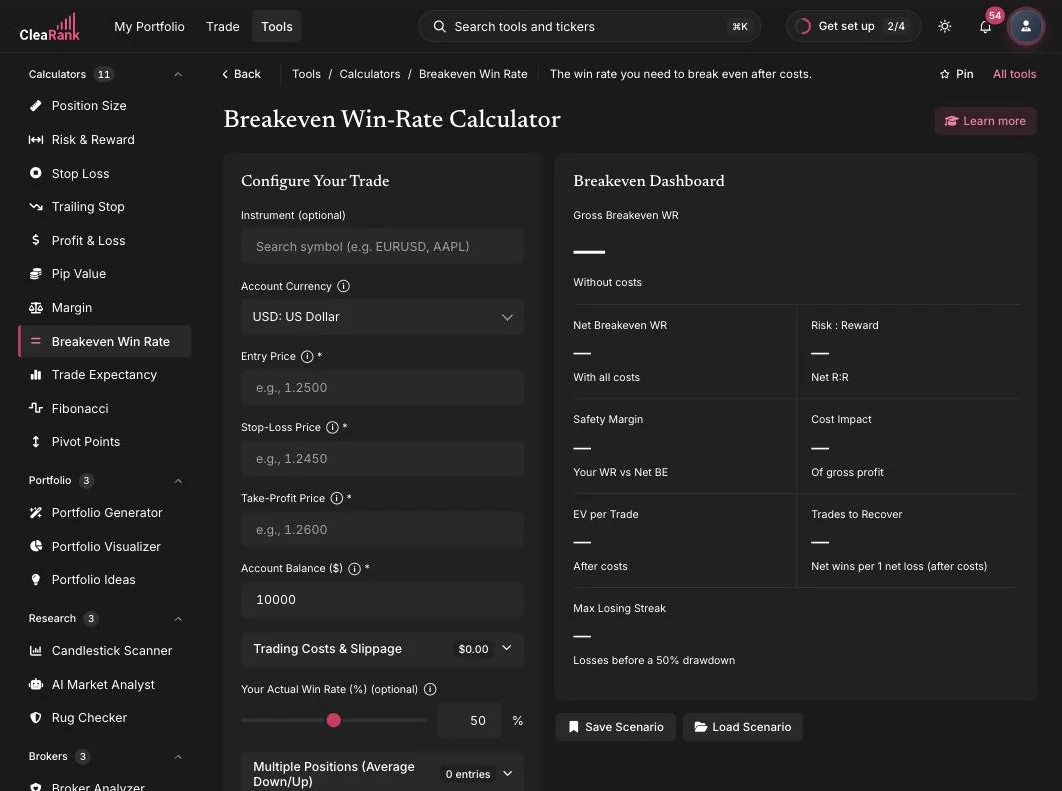
- Instrument (optional). Search a symbol such as EURUSD or AAPL to bring in live market context, or leave it blank and work with raw prices.
- Account Currency and Account Balance. USD: US Dollar and 10,000 in the screenshot; these express the results in money terms.
- Entry, Stop-Loss, and Take-Profit prices. The three required prices that define your risk and reward legs.
- Trading Costs & Slippage. An expandable section (showing $0.00 until you add costs) for fees, swaps, and slippage, so the breakeven rate reflects reality.
- Your Actual Win Rate (optional). A slider (50% by default). Set it to your historical win rate and the calculator shows whether you are above or below breakeven, which is your expectancy in context.
- Multiple Positions (Average Down/Up). Add entries at different prices to model a scaled or averaged position rather than a single fill.
When to test a strategy against its breakeven line
- When evaluating a new strategy: does its typical R:R demand a win rate you realistically have?
- Before tightening a take-profit: a closer target lowers reward and raises the required win rate, sometimes past what your history supports.
- When comparing your journal win rate against the breakeven threshold for how you actually trade. Your Trade Journal analytics give you the historical number to plug into the slider.
- Alongside the Trade Expectancy Calculator, which extends this idea into per-trade dollar expectancy.
The tool shares the suite-wide features: Save Scenario with a Load menu, PDF and CSV export, inline explainers, a Learn More panel, Enter to apply, and light and dark mode. See the Calculators overview.
Frequently asked questions
How do I calculate breakeven win rate?
Divide your risk by the sum of risk and reward. With 50 pips of risk and 100 pips of reward: 50 / 150 = 33.3%. Win more often than that and the strategy is profitable before costs; the calculator also folds in fees, swaps, and slippage for the true threshold.
What win rate do I need for a 1:2 risk reward ratio?
About 33.3% before costs. One 2R winner pays for two 1R losers. After typical spreads and fees the practical figure is slightly higher, which is why the calculator asks for your trading costs.
Why does my breakeven win rate rise when I add fees?
Because costs are paid on every trade regardless of outcome. They shrink each winner and enlarge each loser, so a higher share of trades must win to cover the same ground. High-frequency styles with small targets are hit hardest.
What if my actual win rate is below breakeven?
The strategy loses money over time as traded. You have three levers: improve the win rate, widen the reward relative to risk (better targets or tighter stops), or cut costs. Test changes in the trading simulator before risking anything.
Try it yourself
Find the win rate your strategy actually needs.
Related articles
CleaRank tools are for education and analysis. Nothing in this guide is financial advice.