
Charts, Indicators, and Workspace Layouts
The CleaRank Trading Simulator chart sits alongside the order ticket. It gives you candlesticks across ten timeframes from 1M to 1MO, indicators, drawing tools, the AI and Patterns chips, and panels you can move, resize, and save as named layouts. This guide covers reading the chart, adding indicators, and saving a workspace.
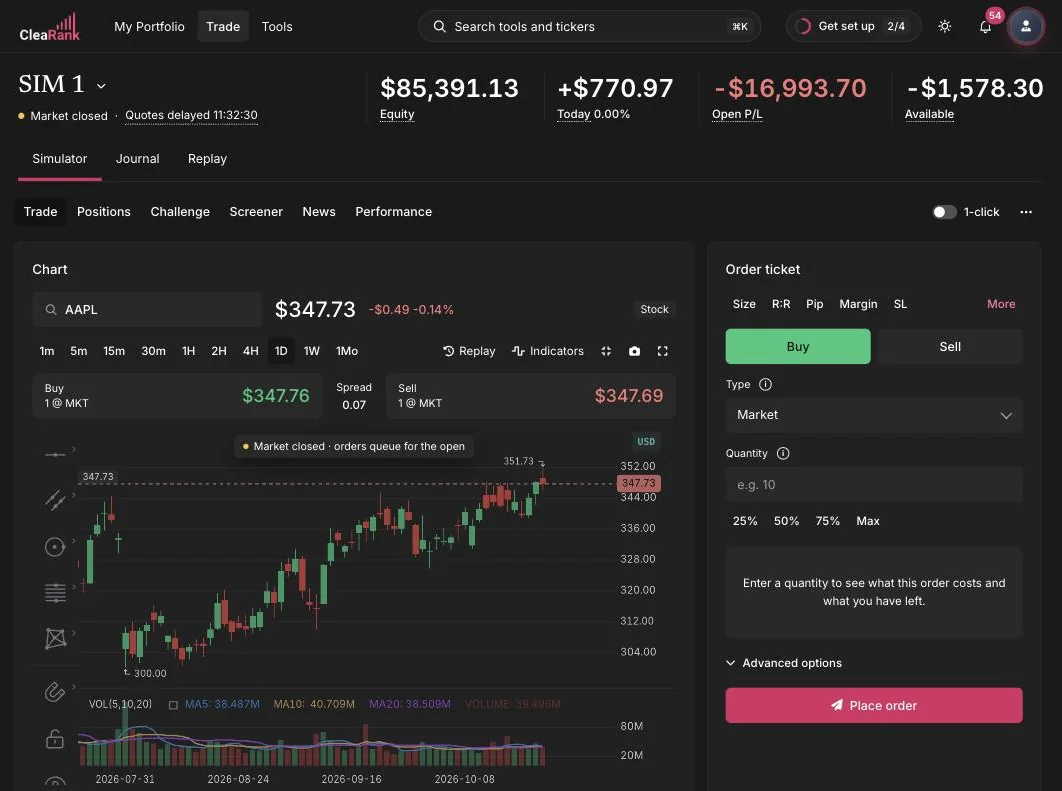
The chart
Type any supported symbol into the chart’s symbol box (stocks, crypto, or forex) and the chart loads live candlesticks with the current price and an asset-class badge (for example, AAPL shows STOCK). Ten timeframe buttons sit under the symbol box: 1M, 5M, 15M, 30M, 1H, 2H, 4H, 1D, 1W, 1MO. Use the short timeframes to practice intraday entries and the daily and higher ones for swing context. Below the toolbar the chart shows a live buy/sell quote bar with the spread between them, so the price you see is the price your order ticket will use.
One thing to know about that quote bar: prices in the simulator are real market quotes, refreshed every 30 seconds and delayed up to one minute, but the bid and ask are modeled, not pulled from a broker’s live quote feed. The simulator places them symmetrically around the live traded price. The cost is real even though the quote is modeled, because fills execute at the bid and the ask: see Placing Orders for the modeled spread width per asset class.
Indicators and drawing tools
The Indicators button on the chart toolbar opens the indicator library of studies you can overlay on the chart. The drawing toolbar on the left edge of the chart holds tools for marking support, resistance, trendlines, and levels.
Two other tools can draw on the chart for you: the Fibonacci Calculator and the Pivot Points Calculator both have a “Draw on chart” action inside the simulator, which paints their levels directly onto the live chart. The Candlestick Scanner can also read the actual chart bars and mark detected patterns on the chart.
The calculator chips
Along the chart toolbar and at the top of the order ticket you will find quick-access chips: Size, R:R, Pip, Margin, Stop, Trail, B/E, Expect, P&L, Fib, and Pivots. Each chip opens an embedded mini-calculator that reads the current chart context, symbol, live price, and your account, so you are not retyping numbers:
- Size: position size from your account risk and stop distance.
- R:R: reward-to-risk ratio from entry, stop, and target.
- Pip: per-pip value for forex pairs.
- Margin: required margin for the position at your leverage.
- Stop: stop-loss placement by risk amount or percent.
- Trail: trailing-stop distance modeling.
- B/E: the win rate you need to break even at a given R:R.
- Expect: trade expectancy from win rate and average win/loss.
- P&L: the profit or loss a position produces at a given exit price.
- Fib: Fibonacci retracement and extension levels, with the Draw on chart action.
- Pivots: pivot support and resistance levels, also drawable on the chart.
Results can be applied straight to the order ticket. The same calculators exist as full standalone tools with PDF and CSV export; see the Calculators overview.
The rest of the chart toolbar
Every remaining chip hands the chart’s current symbol to another tool with the ticker already filled in, so the thing you are looking at is the thing that gets analyzed. That removes the most common research mistake, which is running an analysis on the wrong symbol because you retyped it from memory.
The toolbar sits in two rows. The ten timeframe buttons come first, then the tools row, which starts with Replay and Indicators, runs through the tool chips, and finishes with Reset, Save, and Full.
- AI: opens the CleaRank Financial AI analysis for the symbol on the chart. What comes back is a written interpretation, not a computed score and not a recommendation.
- Patterns: runs the Candlestick Pattern Scanner over the bars on the chart and marks what it finds on the chart itself.
- PortGen: opens the Portfolio Generator.
- PortViz: opens the Portfolio Visualizer.
- Ideas: opens Portfolio Ideas, the curated and fund-manager portfolios you can deploy into the simulator as a basket.
- Reset: returns the chart view to the latest candle after you have scrolled or zoomed away.
- Save: saves the current chart as a PNG image file.
- Full: expands the chart panel to fullscreen, and back again.
What the pattern reliability percentage means
Each pattern card carries a reliability percentage, and it is not a confidence rating for the occurrence in front of you. It is a published historical tendency for that pattern type, fixed per type, so every Hammer always reads 65% and every Bullish Engulfing always reads 72%, whatever the candle looks like or wherever it formed.
The only banding is the color of the bar: 70 and above is green, 55 to 69 is amber, and below 55 is red. Chart annotations are capped at the top 20 patterns by reliability, so a busy chart shows the strongest tendencies rather than every hit. Treat any of them as a reason to look, not a reason to trade, and confirm the pattern against the level it formed at before it changes what you do.
Movable panels and workspace layouts
The Trade tab is built from panels, Chart, Order Ticket, and more, that you can rearrange. Each panel has move controls in its header, and Add Panel in the workspace bar adds more. The workspace bar also holds:
- Workspace selector: switch between saved layouts (Default to start).
- Save: save changes to the current layout.
- Save As: save the current arrangement as a new named layout.
- Reset Layout: return to the standard arrangement if things get messy.
- Flat All: close all open positions at once (see Managing Positions).
Replay
The Replay button on the chart toolbar starts Historical Replay, which plays past price action bar by bar at controllable speed so you can practice reading charts without waiting for live markets. It has its own guide: Historical Replay.
Frequently asked questions
What timeframes does the simulator chart support?
Ten timeframes: 1M, 5M, 15M, 30M, 1H, 2H, 4H, 1D, 1W, and 1MO. Click any timeframe button under the symbol box to switch instantly.
Is the bid, ask, and spread on the quote bar my broker’s real quote?
No. The traded price is a real market quote, refreshed every 30 seconds and delayed up to one minute, but the bid and ask are modeled, not pulled from a broker’s live quote feed: the simulator places them symmetrically around the live traded price. The cost is real even though the quote is modeled, because fills execute at the bid and the ask. See Placing Orders for the modeled spread width per asset class.
Can I save more than one chart layout?
Yes. Arrange your panels, then use Save As in the workspace bar to store the arrangement under a new name. Switch between layouts with the Workspace selector, and use Reset Layout to return to the default at any time.
What do the chips on the chart toolbar do?
The calculator chips open embedded mini-calculators that read the current symbol, live price, and your account context: position size, reward-to-risk, pip value, margin, stop placement, trailing distance, breakeven win rate, expectancy, profit and loss, Fibonacci levels, and pivot levels. The remaining chips hand the chart’s symbol to a full tool, AI for a written CleaRank Financial AI analysis, Patterns for the Candlestick Pattern Scanner, and PortGen, PortViz, and Ideas for the portfolio tools.
What does the Save button on the toolbar save?
Save on the chart toolbar exports the current chart as a PNG image file. The Save button in the workspace bar is a different control: it saves your panel layout. Reset returns the chart view to the latest candle, and Full expands the chart to fullscreen.
Why is my chart frozen?
When a market is closed the chart freezes and shows a Market Closed badge, because there are no live ticks to draw. Crypto charts run 24/7, forex 24/5, and stock charts follow exchange hours. See Placing Orders for details.
Try it yourself
Open the chart, add an indicator, and save your first custom layout.
Related articles
CleaRank tools are for education and analysis. Nothing in this guide is financial advice.