
Market News and Sentiment
The News tab in the CleaRank Trading Simulator collects market context in one place: AI-summarized headlines for any ticker, a CleaRank Financial AI sentiment gauge, an 11-sector heatmap of measured sector performance, and an economic calendar. This guide explains each panel and how to tell measured data from an AI-generated reading.
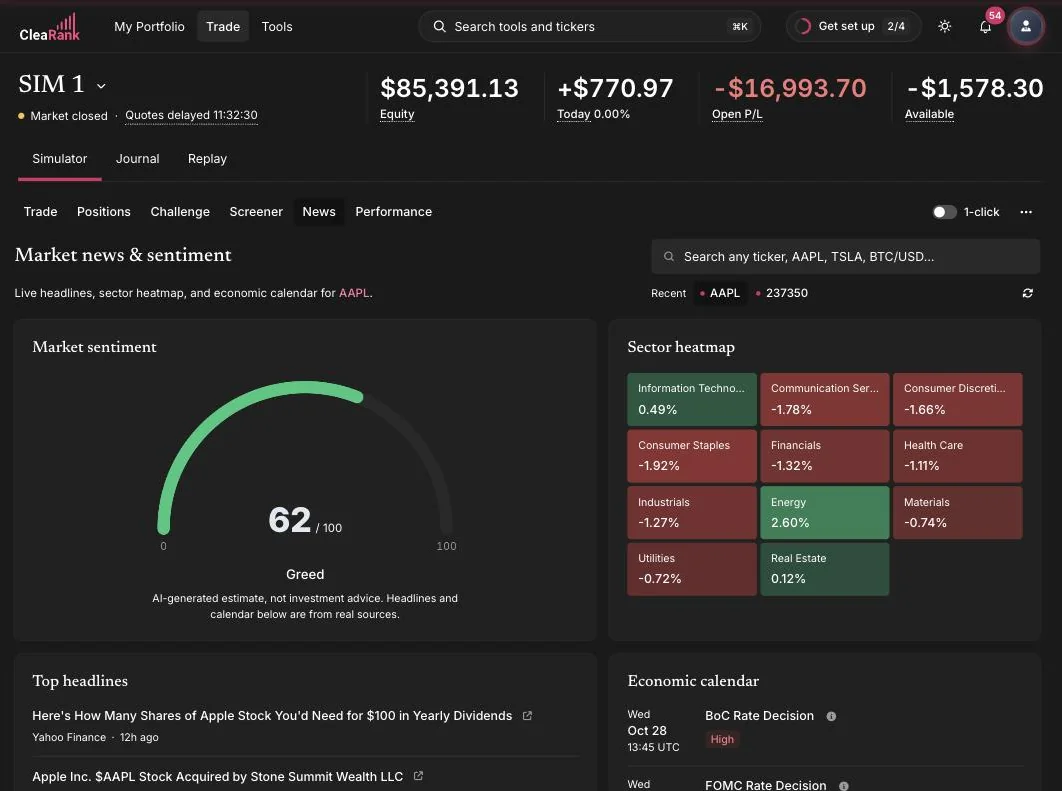
Headlines and ticker search
The tab is symbol-aware. A search box at the top accepts any ticker, AAPL, TSLA, BTC/USD, and quick chips recall your recent symbols. The Top Headlines section then lists AI-summarized headlines for the selected symbol, so you get the story behind the chart without leaving the simulator.
The sentiment gauge
The gauge scores the mood around the symbol you selected on a 0 to 100 scale. It is CleaRank Financial AI’s own read of that mood, drawn from what it already knows about the symbol rather than from a live web search or a measured market index, and it is refreshed periodically per symbol rather than on every tick. Use it as a one-glance weather report before a practice session: a strongly bullish reading suggests momentum longs have a tailwind, a bearish one suggests rallies may struggle, and a neutral reading warns that the market lacks a clear direction to lean on.
What the bands mean
- 80 to 100: Extreme Greed
- 60 to 79: Greed
- 41 to 59: Neutral
- 21 to 40: Fear
- 0 to 20: Extreme Fear
The bands are not symmetric, so the boundaries are worth remembering: exactly 40 reads Fear, exactly 60 reads Greed, and exactly 20 reads Extreme Fear.
Extremes are where crowded positioning shows up. An Extreme Greed reading is a reason to tighten risk on new longs rather than a reason to buy more, and an Extreme Fear reading tells you the crowd is already defensive, which argues for patience and smaller size rather than for chasing the drop.
The 11-sector heatmap
The heatmap breaks the market into eleven sectors (information technology, financials, health care, energy, and the rest) and colors each by how it is performing. That color is measured percent change for the sector, not a sentiment reading and not an AI opinion, which makes it the one number on this tab you can take at face value. It answers where money is flowing today. Two practical reads:
- Confirmation. If you are practicing a long in a tech stock, a green technology sector supports the idea; a deep red one is a warning that you are fighting the sector tide.
- Rotation. When leadership flips, for example energy turning green while tech fades, the heatmap shows it before you would notice it symbol by symbol. Pair it with the Market Screener to find the specific names moving inside a hot sector.
The economic calendar
The calendar lists upcoming events and releases, the scheduled moments when markets tend to move: earnings reports, central bank decisions, inflation prints, employment reports. Entries are validated before they are shown and anything that cannot be verified is dropped, so if too few survive you see “No verified upcoming events” rather than invented entries. For practice trading it matters in both directions:
- Avoid surprises. A calm chart can turn violent at a release time. Check the calendar before opening practice positions so a scheduled event does not masquerade as random chaos.
- Practice events deliberately. The simulator is the safe place to experience what a major release does to spreads and price, sit through one with a small practice position and watch.
Using the News tab in a session
- Start with the gauge. Note the overall mood before you form any trade ideas, and check that you are not looking at a fallback 50.
- Scan the heatmap. Identify the strongest and weakest sectors and prefer setups that align with them.
- Check the calendar. Note any releases due during your session and decide in advance whether you will trade through them.
- Then go to the chart. With context set, run the Screener or open your watchlist and evaluate individual setups.
Frequently asked questions
Where does the sentiment reading come from?
It is CleaRank Financial AI’s own read of the mood around the symbol you selected, drawn from what it already knows rather than from a live web search or a measured index. It is refreshed periodically per symbol rather than on every tick. Treat it as informational context for your own analysis, not as a trading signal.
What do the gauge bands mean?
80 to 100 is Extreme Greed, 60 to 79 is Greed, 41 to 59 is Neutral, 21 to 40 is Fear, and 0 to 20 is Extreme Fear. The bands are not symmetric, so the boundaries matter: exactly 40 reads Fear, exactly 60 reads Greed, and exactly 20 reads Extreme Fear.
Why does the gauge show exactly 50 with no headlines?
That is the fallback. If CleaRank Financial AI cannot produce a reading, the tab still loads, the gauge sits at exactly 50, and the headline list comes back empty. It means no reading is available, not that the market is balanced.
What are the 11 sectors in the heatmap?
The heatmap follows the standard market sector breakdown (information technology, financials, energy, health care, and the other major groups) and colors each by how it is performing. Those colors come from measured percent change, not from a sentiment reading, so you can spot leadership and rotation at a glance.
Why should a practice trader care about the economic calendar?
Scheduled releases are when markets move most violently. Knowing one is due lets you either stand aside or deliberately practice trading through it, and the simulator is the safe place to learn what those moments feel like. Events are validated before they appear, so you only see entries that could be verified.
Is the News tab a substitute for doing my own research?
No. It compresses market context into a few quick reads so your practice decisions are informed, but the analysis, entry, and risk plan are still yours. That is the skill the simulator exists to build.
Try it yourself
Check the gauge, the heatmap, and the calendar before your next practice session.
Related articles
CleaRank tools are for education and analysis. Nothing in this guide is financial advice.