
Written by Michelle Sofia Michelle Sofia
Market Analyst
As a financial journalist and a SEO specialist my passion for making education in finance accessible runs deep. My work combines hands-on market trend analysis with straightforward writing to create content that’s both informative and easy to understand for the average reader. At CleaRank, we’ve built our reputation on a simple idea: transparent broker comparisons shouldn’t be reserved for experts because everyone deserves clear and transparent information, especially when it comes to choosing a broker. Day to day, I focus on refining our educational materials to maximize their visibility and usefulness across trading communities. using our CLEAR™ Methodology The CLEAR™ Score (Credibility, Leverage, Execution, Accessibility, Regulation) is our proprietary ranking system. The CLEAR™ Score provides you with the most accurate and transparent broker ranking after evaluating all the key factors that are crucial for trading success. .
Last fact checked on July 1, 2025
Stock Technical Analysis
Previously, we learned that fundamental analysis is the key factor to a successful stock trading career, especially for long-term investors that are interested in developing a solid investment portfolio. In this section, we’ll be focusing on short-term traders, who we recommend to combine technical analysis to study price movements and patterns to predict future trends. CleaRank’s analysts agree unanimously that technical analysis is a must have tool for traders, because of how much it helps traders decide whether to buy, sell or hold a stock.
Unlike fundamental analysis, which we explained is the process of determining whether a certain stock is a good investment choice by evaluating a company’s financial health, industry position, and overall market potential, technical analysis is mainly about timing your trades using chart types, trend analysis, key indicators, and chart patterns to predict market behavior.
Welcome to The World of Charting: Candlestick, Bar, and Line Charts
Charts are considered to be the foundation of technical analysis. Simply put, they’re a visual representation of a stock’s price movement over time. If done correctly, charts will equip you with the crucial indicators you need for predicting future market behavior. Don’t stress, this is something that improves with practice: the more you do it, the better you get.
Candlestick Charts
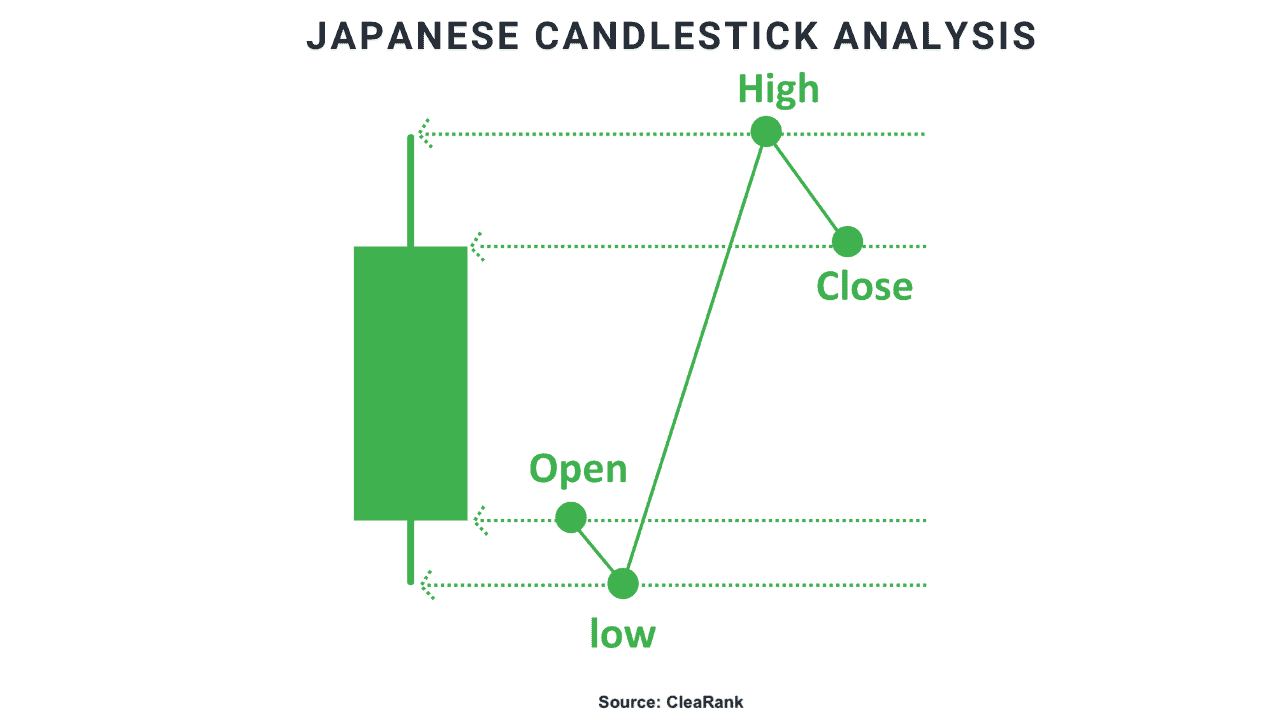
First up are candlestick charts, the most popular type of chart in technical analysis. With them you get detailed information about price movements during a specific time period, including opening, closing, high, and low prices.
Candlestick Component | What It Indicates |
|---|---|
Body | The range between the opening and closing prices. |
Wick (or Shadow) | The high and low prices during the time period. |
Color | Green (or white) indicates a price increase, while red (or black) indicates a price decrease. |
Example: A long green candlestick with a short wick suggests a price increase with strong buying pressure, while a red candlestick with a long upper wick indicates a price decrease with strong selling pressure.
Bar Charts
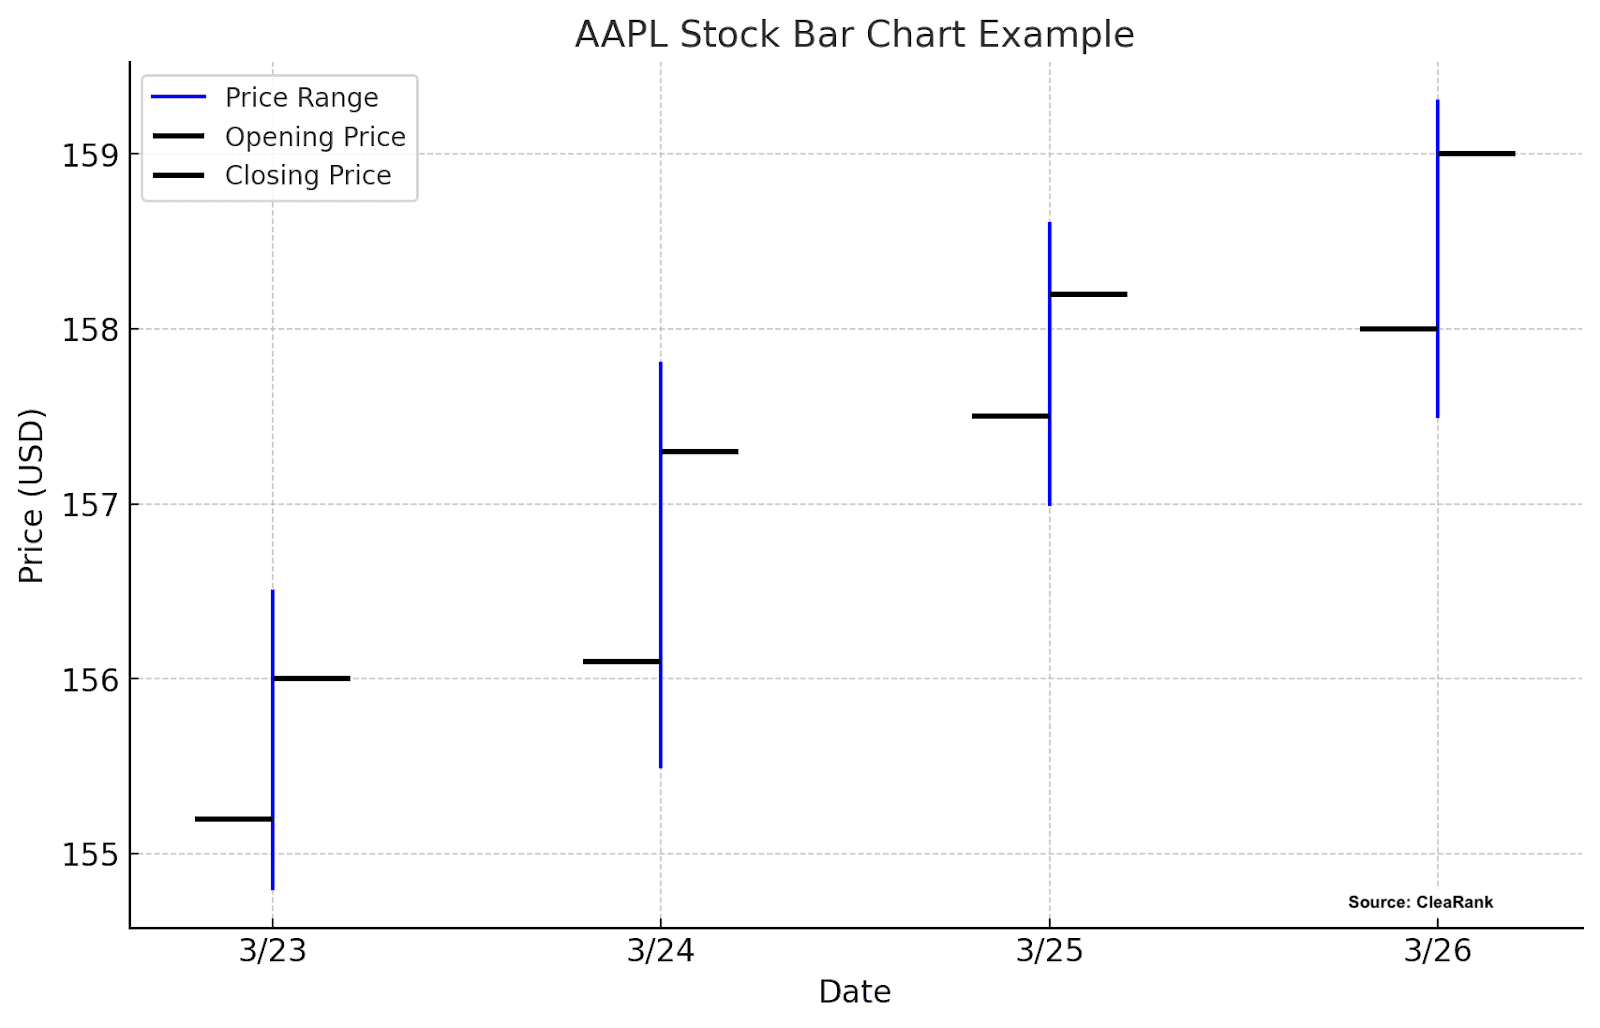
Bar charts are just a more minimalistic way of displaying the open, high, low and close prices.
Advantages | Why Use It? |
|---|---|
Compact Design | Easier to analyze when viewing multiple stocks. |
Quick Insights | Useful for spotting daily price ranges and trends. |
Line Charts
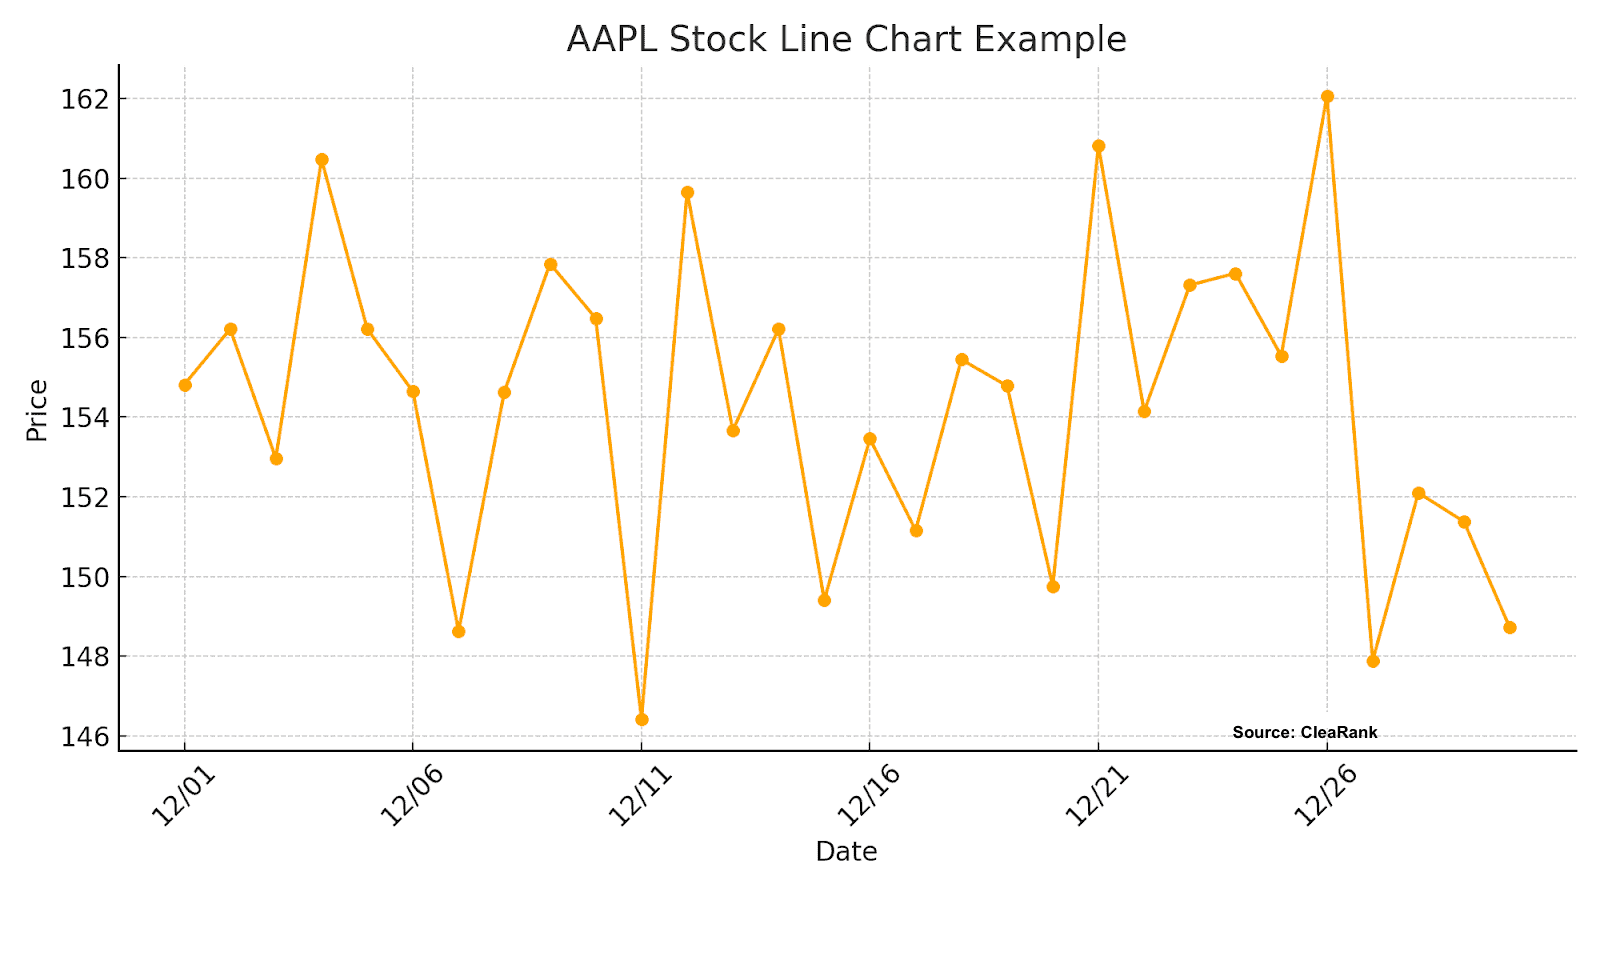
Line charts are used for connecting closing prices over time to create a smooth line.
Advantages | Why Use It? |
|---|---|
Simplicity | Ideal for beginners or long-term trend analysis. |
Clarity | Eliminates noise from intraday price fluctuations. |
While line charts are great for a high-level overview, candlestick and bar charts are the preferred strategy when doing a more thorough analysis.
You can use CleaRank’s Charts to start practicing technical analysis.
Trend Analysis: Uptrend, Downtrend, Sideways
Identifying trends is one of the most critical skills in technical analysis. Trends show the overall direction of a stock’s price movement.
Your goal should always be to identify the trend of a stock’s price movement. This is one of the most critical skills you can learn, ensure you slowly work on this as you move you forward.
Uptrend
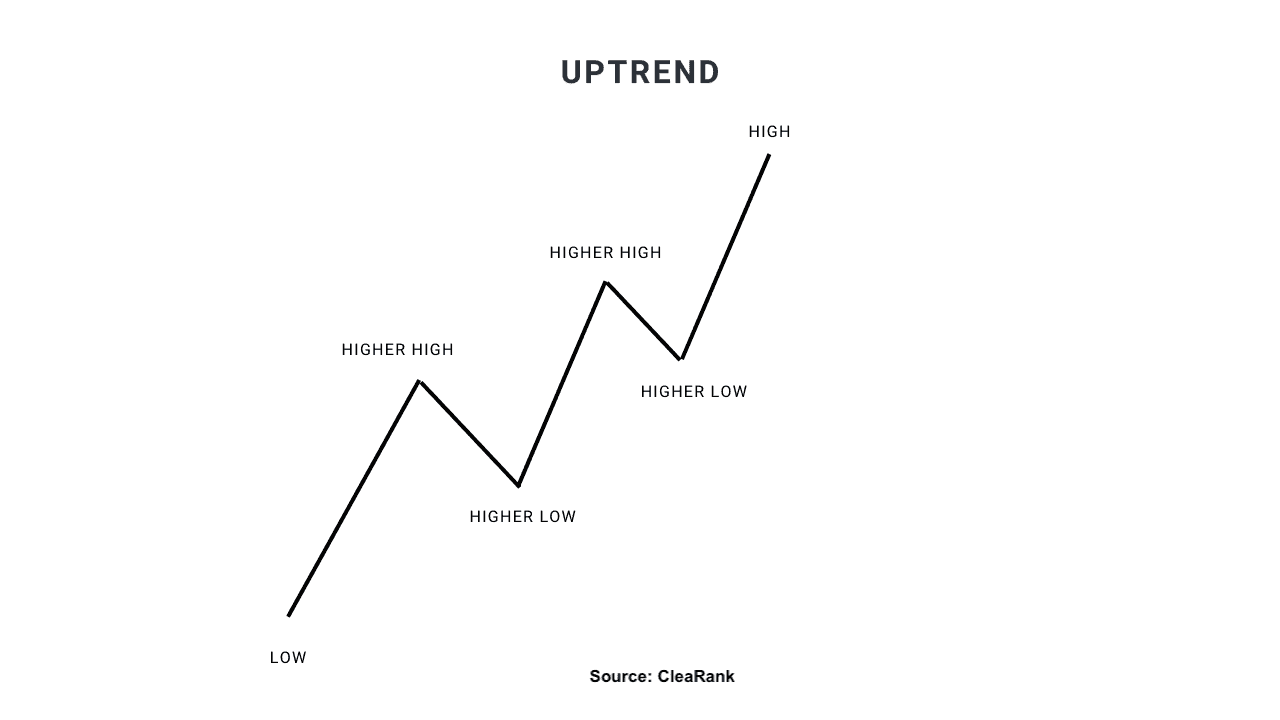
As the name implies, an uptrend occurs when a stock’s price consistently makes higher highs and higher lows.
Characteristics | What It Means |
|---|---|
Higher Highs | Indicates strong buying momentum. |
Higher Lows | Suggests buyers are willing to step in at higher prices. |
Example: A stock moving from $60 to $70 to $80 while forming higher lows at $58, $65, and $75 is in an uptrend.
Downtrend
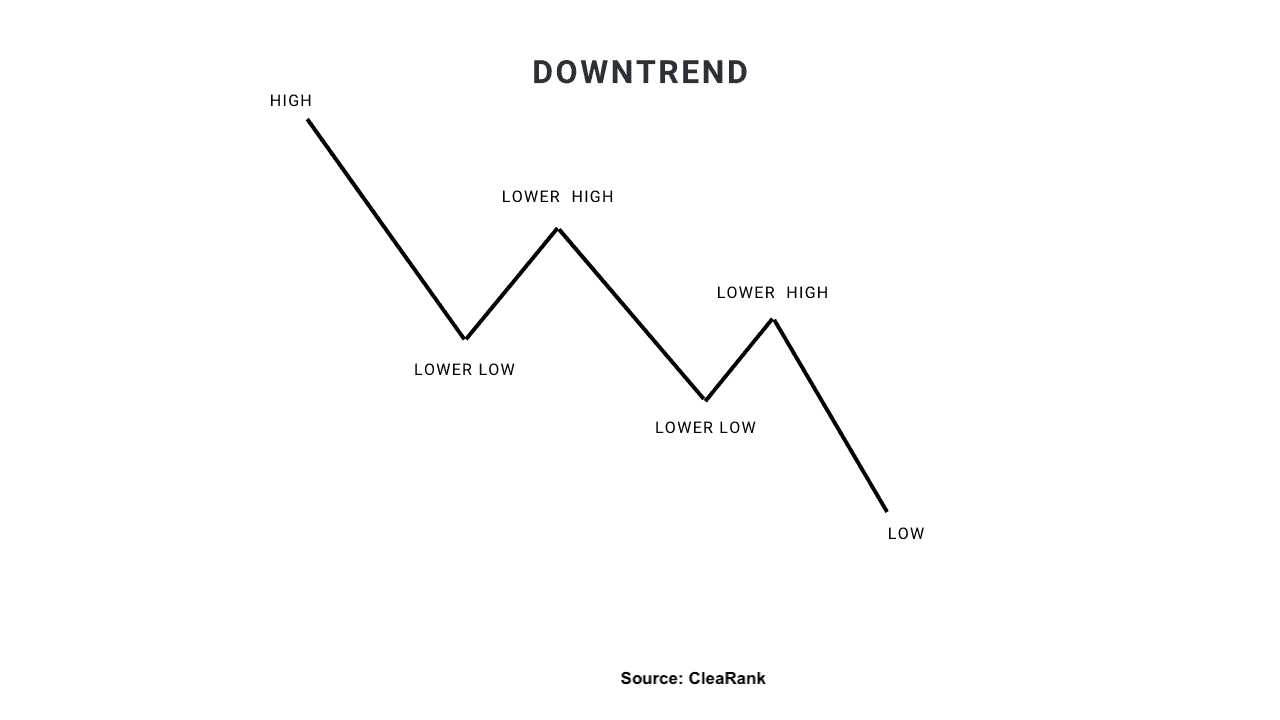
Opposite to an uptrend, a downtrend is characterized by lower highs and lower lows, pointing to bearish sentiment.
Characteristics | What It Means |
|---|---|
Lower Highs | Indicates strong selling pressure. |
Lower Lows | Suggests sellers are driving prices lower. |
Sideways (or Range-Bound)
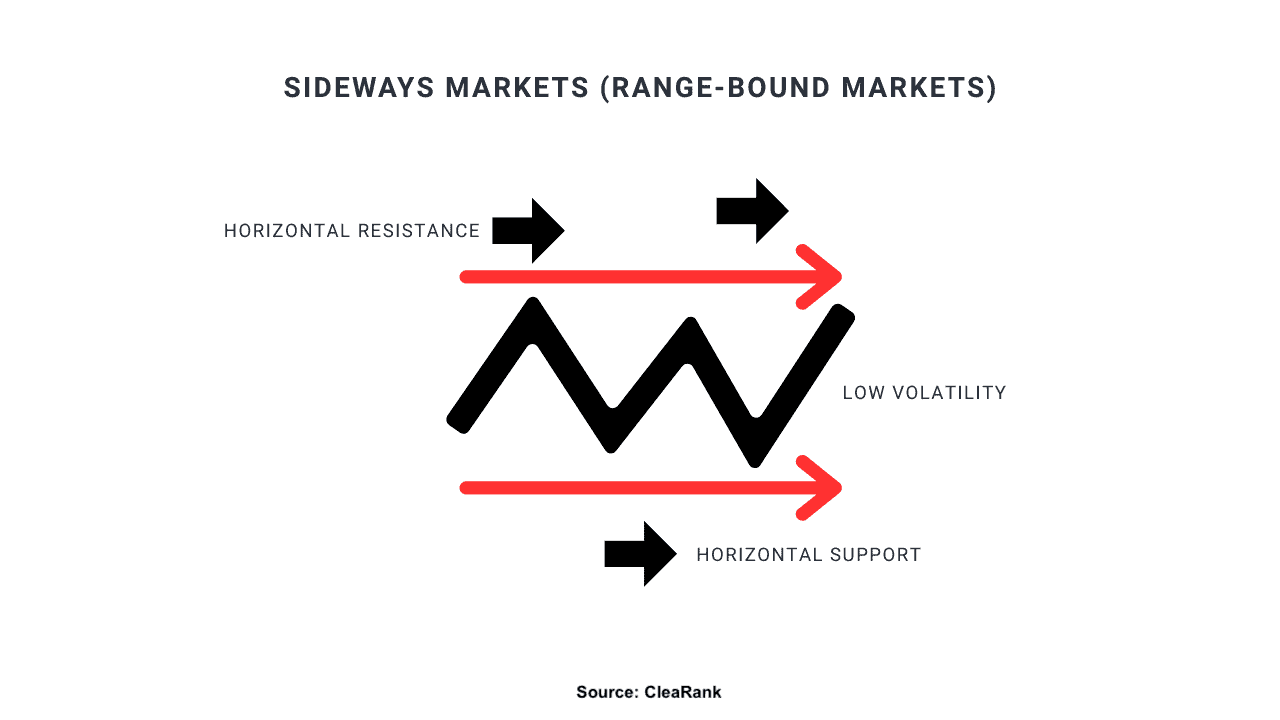
When a stock’s price fluctuates within a narrow range without a clear upward or downward trend, it is in a sideways trend.
Characteristics | What It Means |
|---|---|
Resistance Level | The price ceiling where selling pressure increases. |
Support Level | The price floor where buying pressure increases. |
Key Indicators: Moving Averages, RSI, MACD, Bollinger Bands
Indicators are your market “cheat codes”—mathematical calculations that crunch a stock’s price and volume data to spot trends, identify hidden clues, and opportunities. Think of Indicators as your GPS when trading in today’s uncertain markets. Don’t worry, you don’t need a fancy degree to master this.
Moving Averages
Moving averages smooth out price jumps to show you the bigger picture and identify in which direction things are actually going.
Type | Description |
|---|---|
Simple Moving Average (SMA) | Averages closing prices over a set period, such as 50 or 200 days. |
Exponential Moving Average (EMA) | Gives more weight to recent prices, making it more responsive to current trends. |
Example: If a stock’s price is consistently above its 50-day SMA, it’s like the market is whispering to you “uptrend ahead”.
Relative Strength Index (RSI)
The RSI measures the speed and magnitude of price changes, indicating whether a stock is overbought or oversold. You can look at this as your 0-100 speedometer, which tells you when a stock’s gone too far, too fast!
Range | What It Means |
|---|---|
Above 70 | Overbought, indicating a potential reversal downward. |
Below 30 | Oversold, indicating a potential reversal upward. |
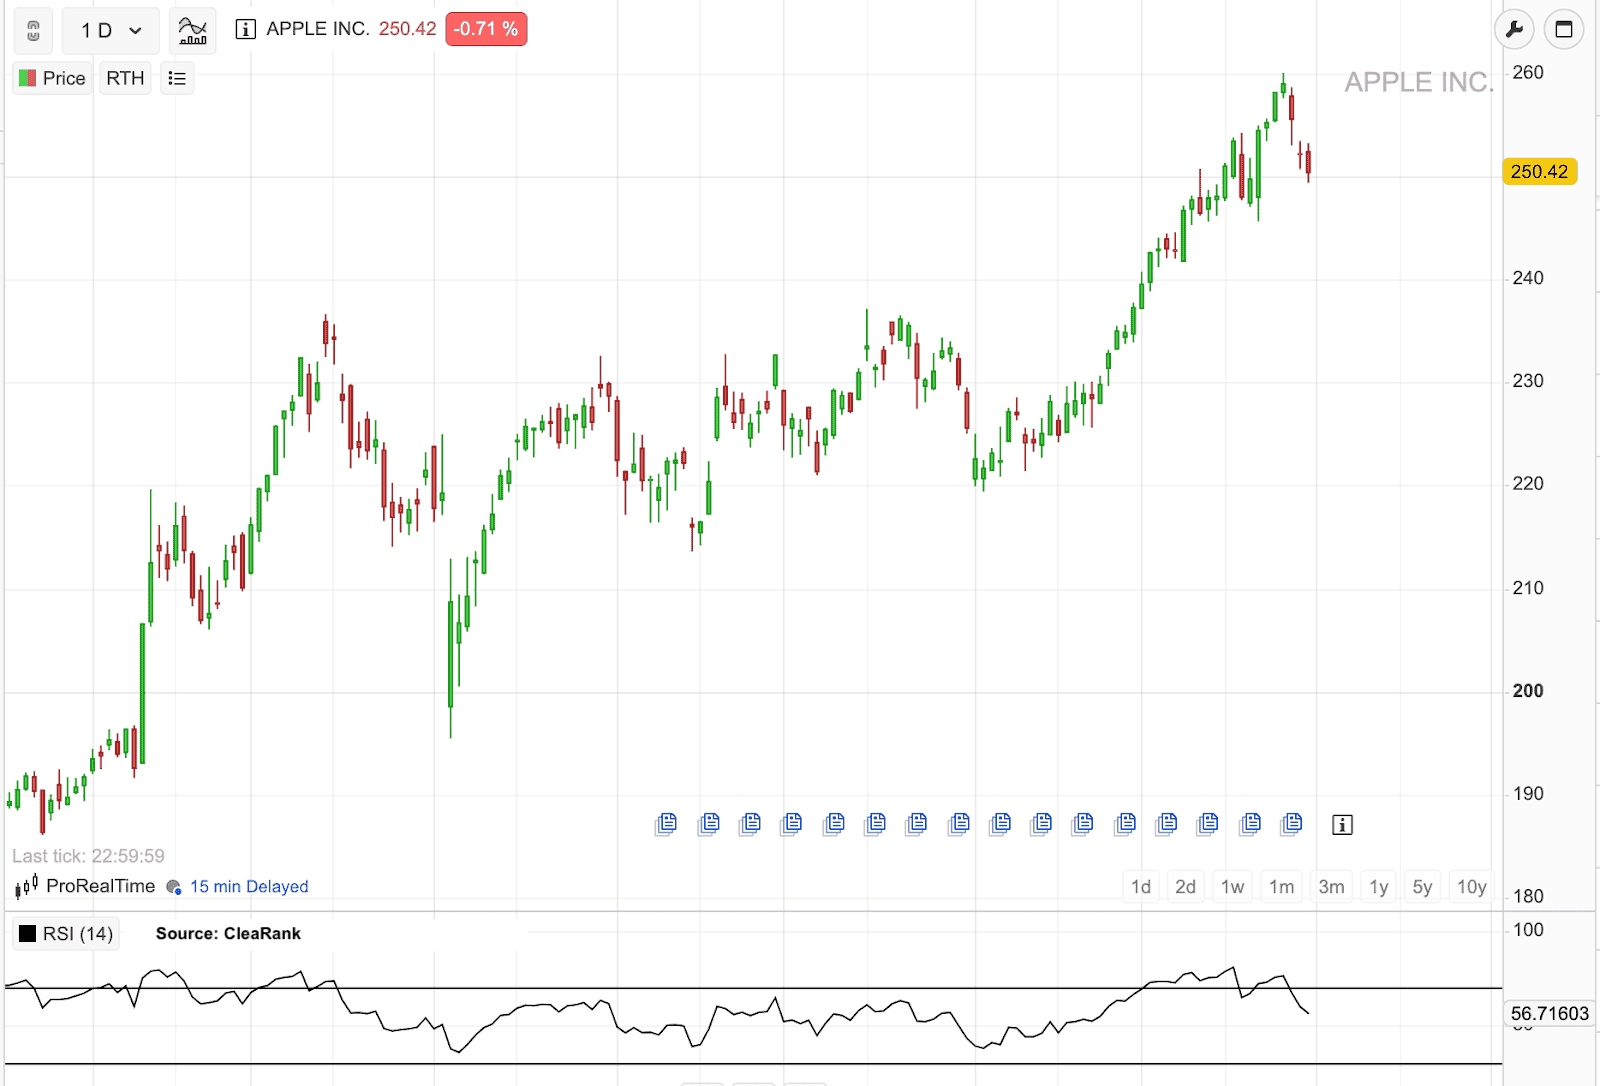
Pro Tip: RSI is used to filter out Hype and FOMO, and allow traders to make smarter investment decisions.
Moving Average Convergence Divergence (MACD)
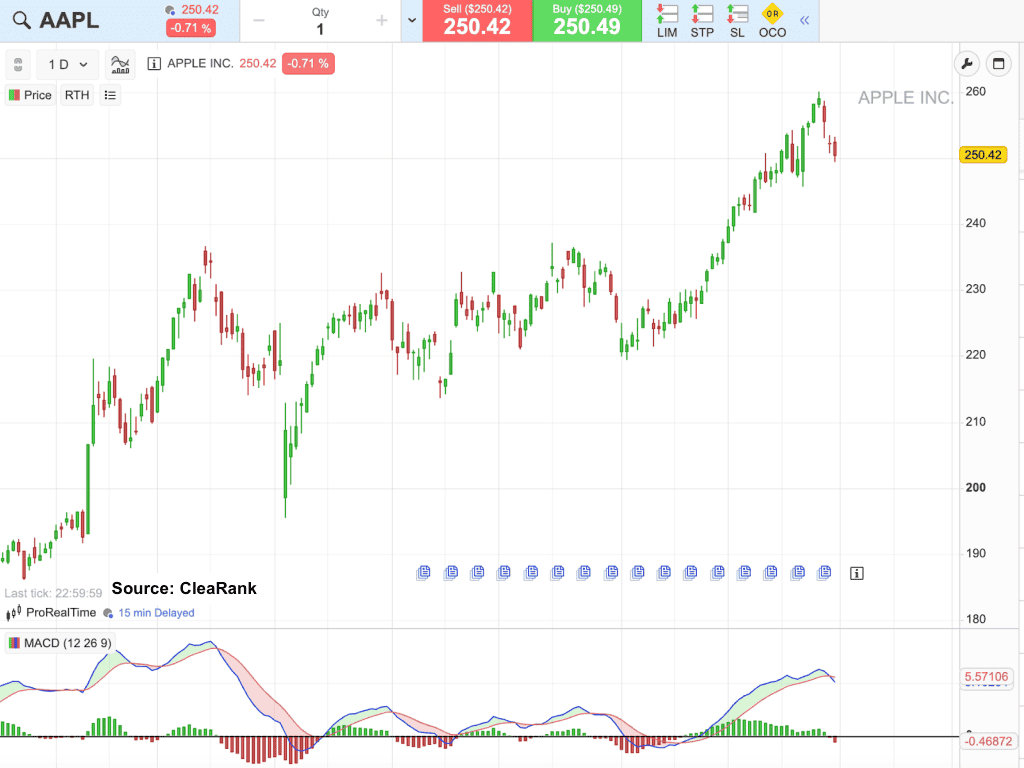
The MACD shows the relationship between two moving averages (usually the 12-day and 26-day EMAs) to identify momentum. It’s like a tug-of-war between short-term and long-term trends.
Signal | What It Means |
|---|---|
Bullish Crossover | When the MACD line jumps above its signal line—traders see this as the “green light” to ride an upward wave. |
Bearish Crossover | The opposite. If it dips below, it’s like a storm warning for downward momentum. |
Bollinger Bands
Bollinger Bands consist of a moving average and two standard deviation lines above and below it.
Signal | What It Means |
|---|---|
Price Touches Upper Band | The stock’s partying too hard—might be due for a hangover (pullback) |
Price Touches Lower Band | It’s been beaten down—could bounce back soon. |
Bollinger Bands are particularly useful for identifying periods of high volatility. When the bands squeeze tight, it’s like the market holding its breath… and when they expand, boom—big moves ahead.
None of these are crystal balls, but together they help you see patterns in the mess. The trick? Use them all for a broader analysis rather than relying on one thing and practice spotting how they interact—like how an RSI oversold signal + a Bollinger Band bounce might hint at a turnaround.
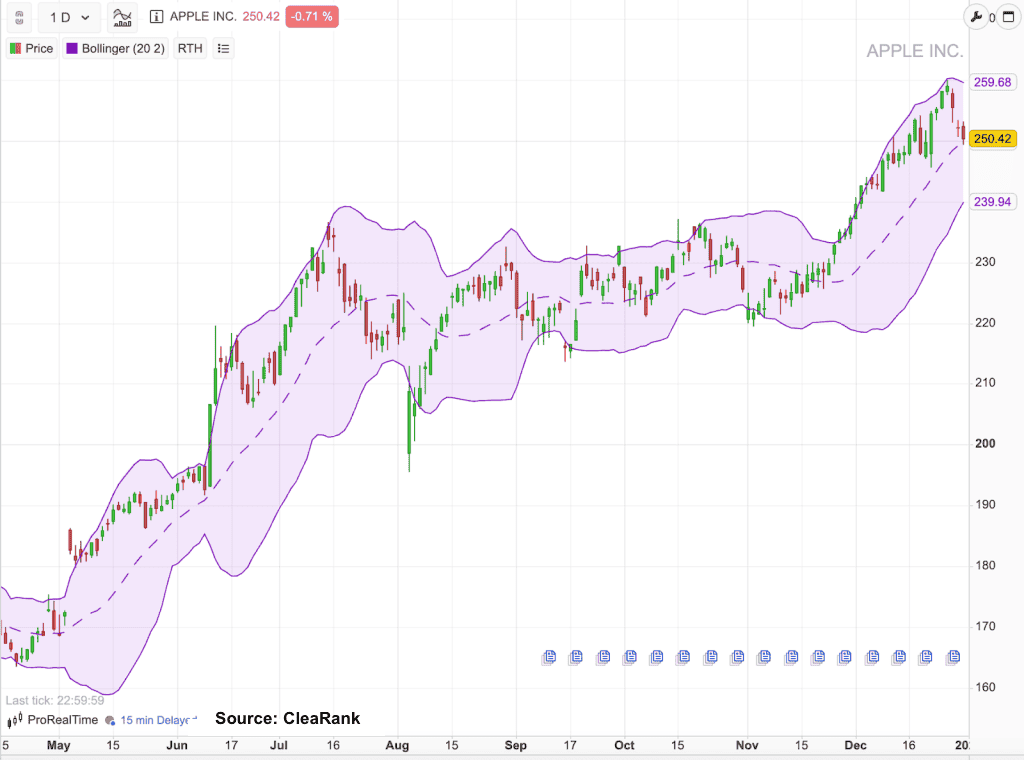
Chart Patterns: Head and Shoulders, Double Tops and Bottoms
Chart patterns are taking all the chart trends in a specific time period and using them to find visual hints of where things might head next. Gaining the skill of recognizing different chart patterns will give you the edge in timing your trades and you’ll start seeing clues about when to jump in or step back. It’s not magic, just about reading the market’s rhythm before everyone else catches on.
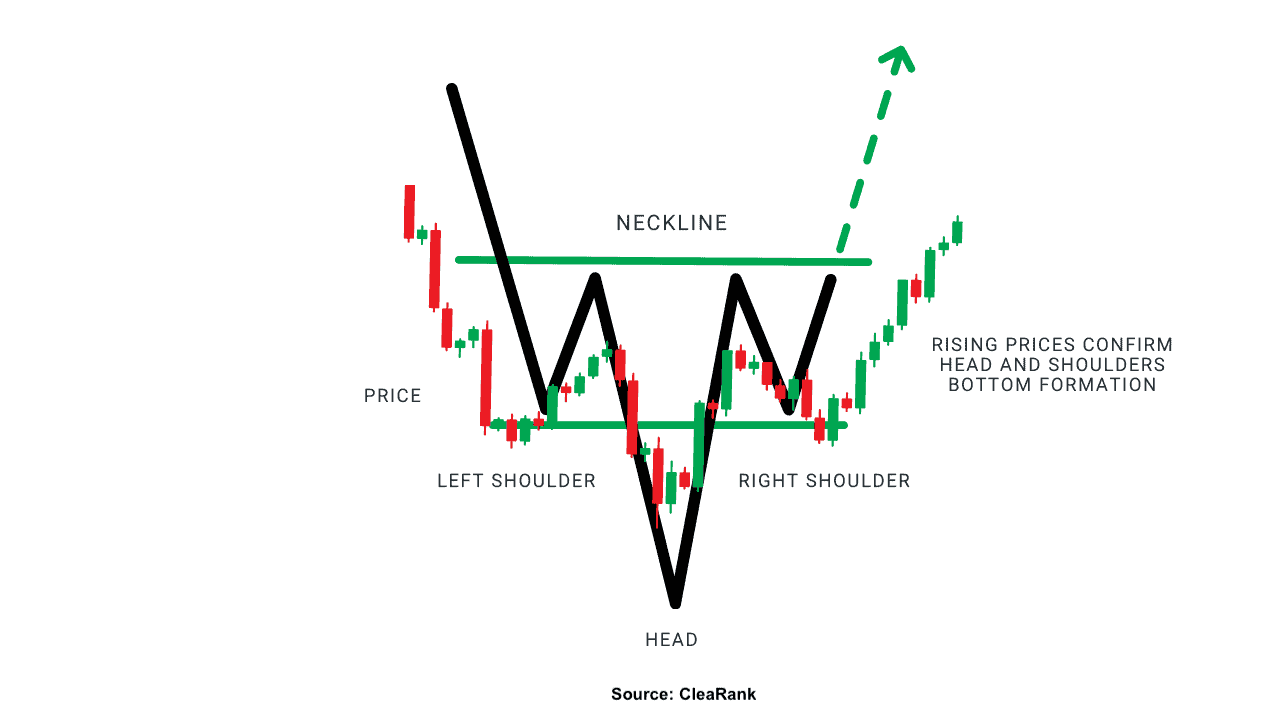
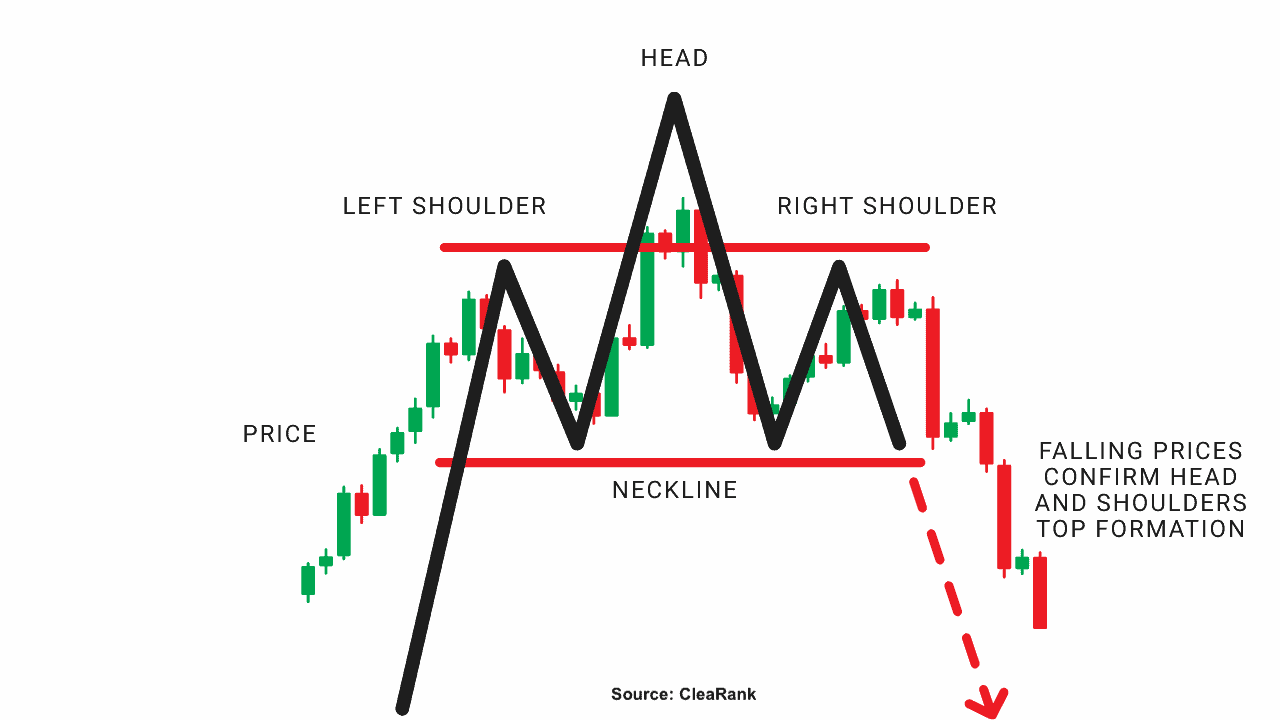
Head and Shoulders
The head and shoulders pattern indicates a reversal from an uptrend to a downtrend.
Component | What It Means |
|---|---|
Left Shoulder | A high followed by a slight decline. |
Head | A higher peak followed by another decline. |
Right Shoulder | A lower high, signaling weakening momentum. |
When the price breaks below the “neckline,” it often triggers a downward move.
Double Tops and Bottoms
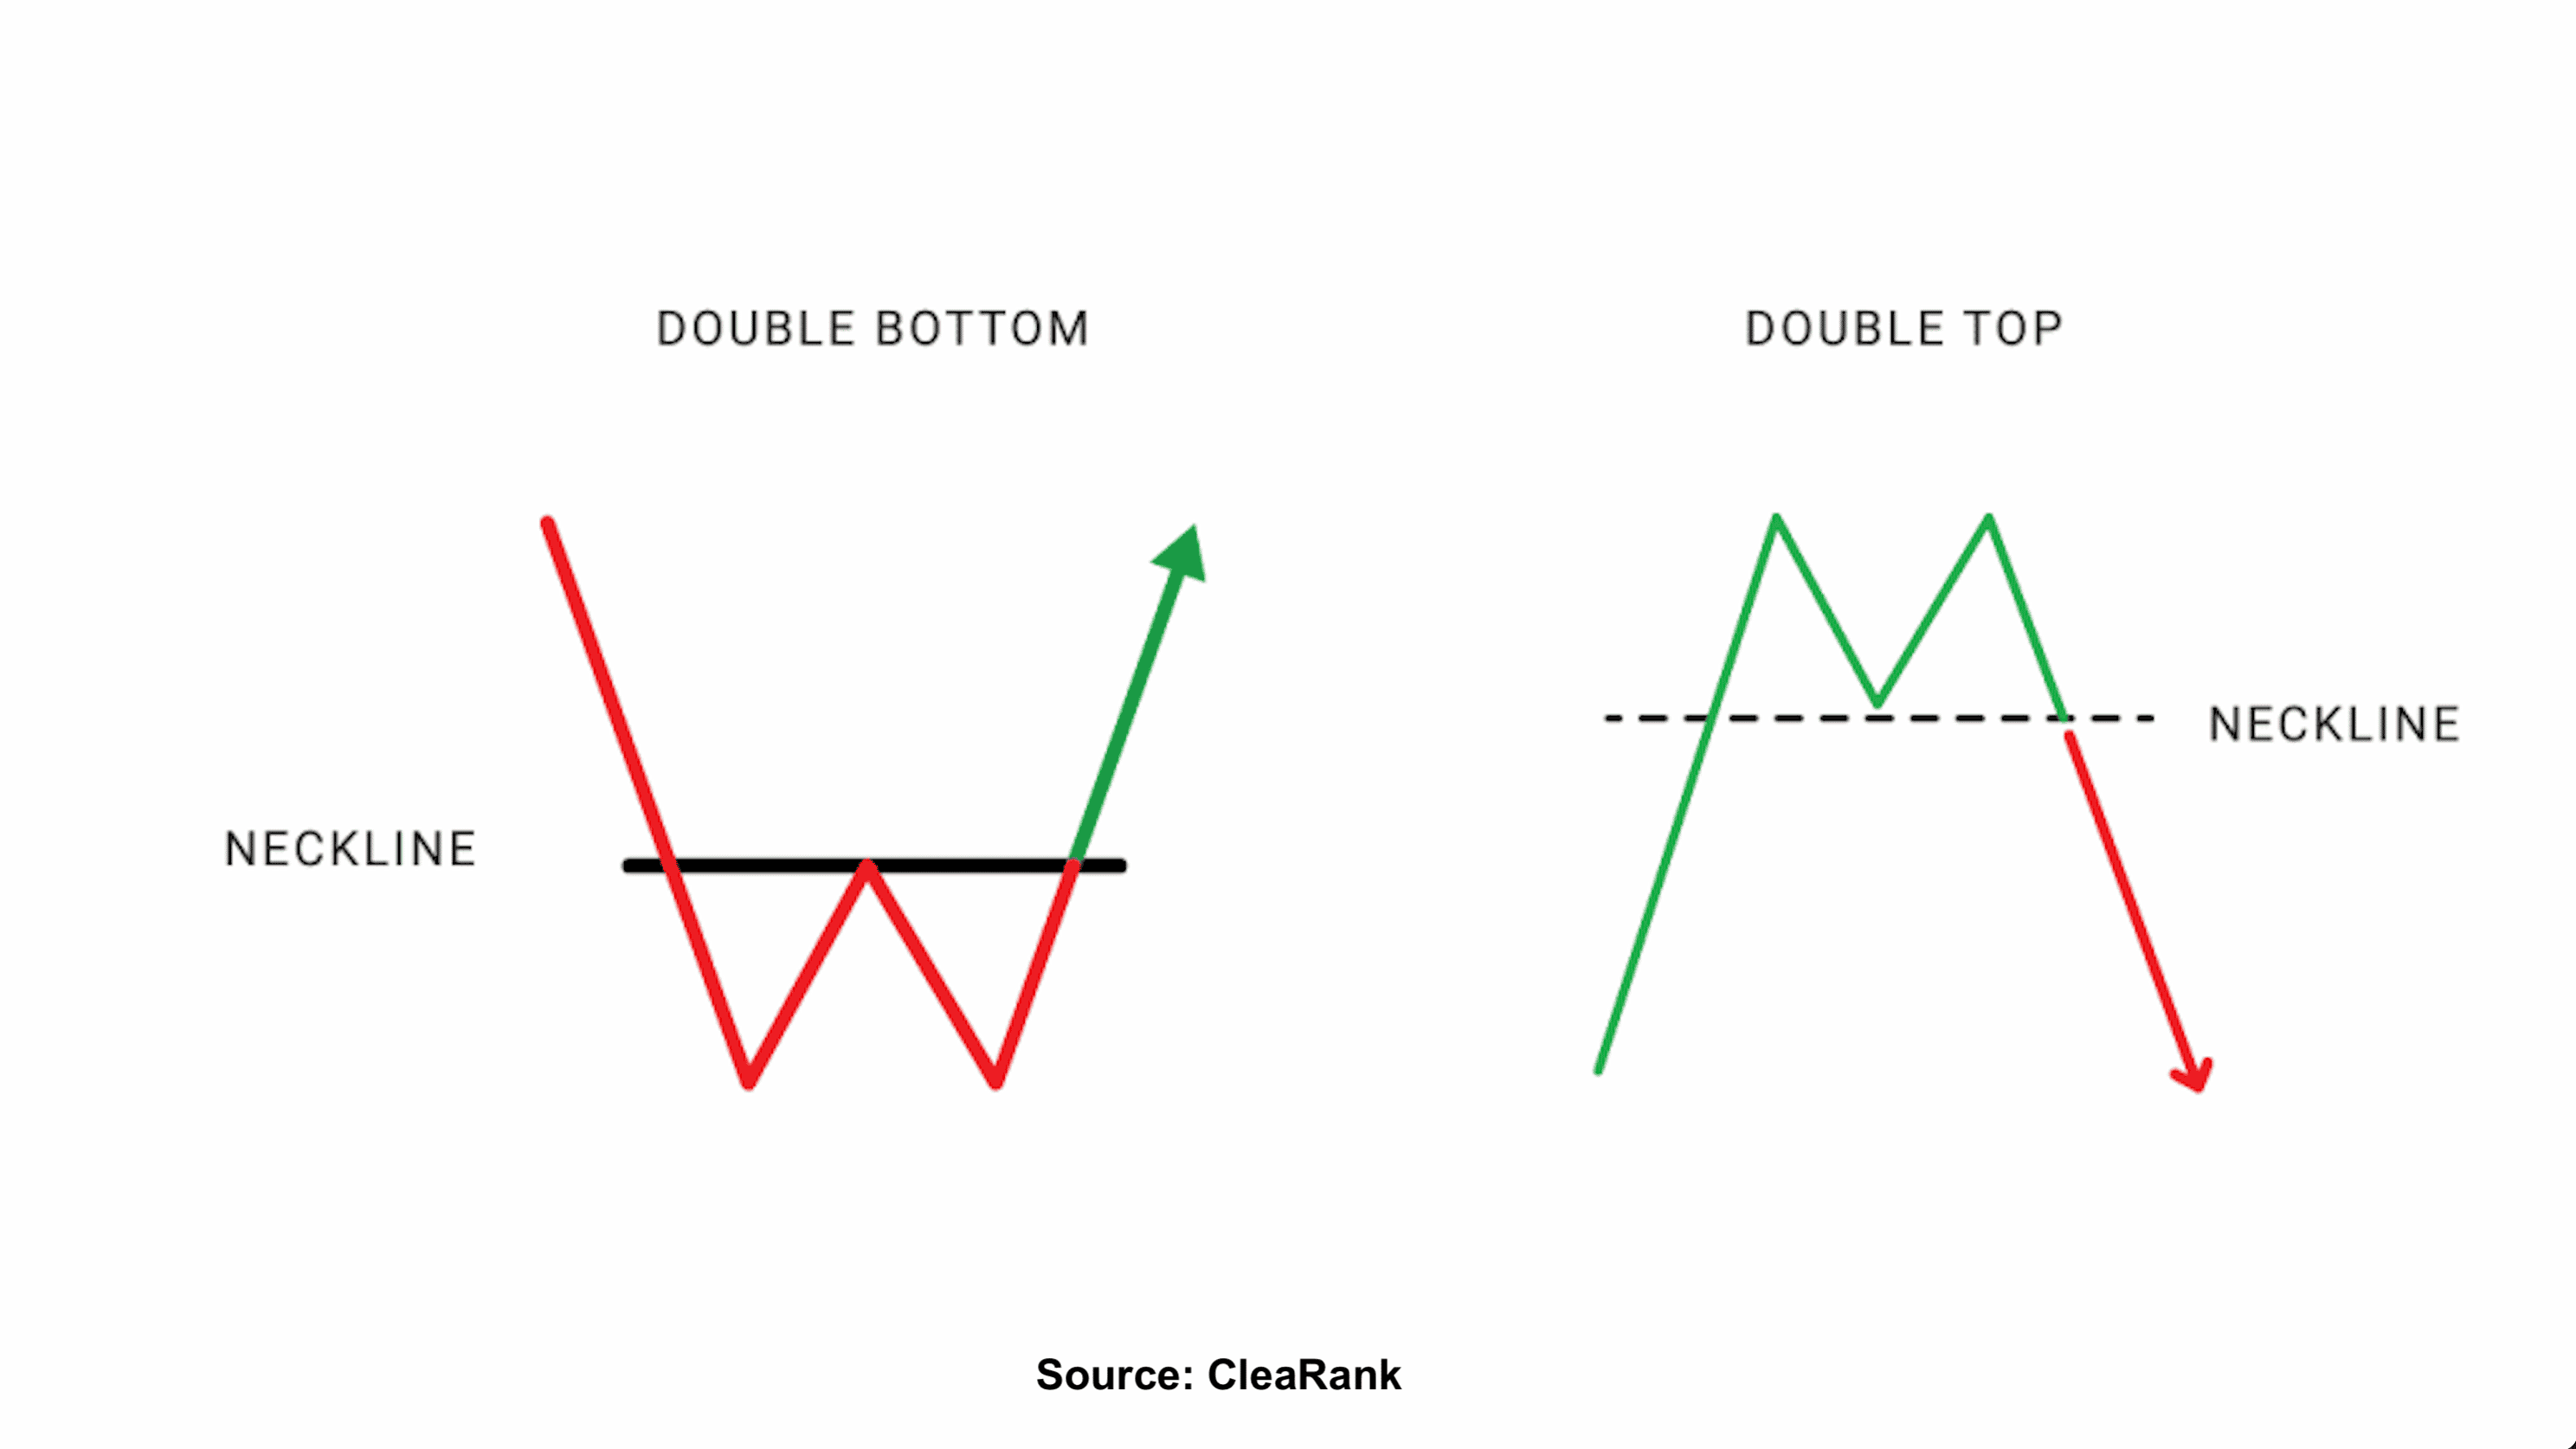
These patterns signal potential reversals.
Pattern | What It Means |
|---|---|
Double Top | Two peaks at a similar price level, followed by a decline, indicating bearish sentiment. |
Double Bottom | Two troughs at a similar price level, followed by a rise, indicating bullish sentiment. |
Example: A double top at $150 suggests strong resistance and a double bottom at $100 implies strong support.
Feel like chart patterns are a but overwhelming? Don’t worry, we got you! Just upload your OHLCV data to our Chart Pattern Scanner™ and it will tell you everything you need to know.
Practical Application of Technical Analysis
Technical analysis isn’t about memorizing rules—it’s like learning to cook. You’ve got your ingredients (charts, trends, indicators, patterns), and now it’s time to mix them into a strategy that you find delicious. For Example:
- Bollinger Bands (track volatility) to jump on potential breakouts before they happen.
- Use moving averages to confirm the trend.
- Look for chart patterns such as “head and shoulders” for timing your entry correctly.
What’s Next: Stock Trading Strategies
You’ve got the tools. Next, we’ll talk about how to use them in the wild with different Stock Trading Strategies. You’ll learn how to pick your style, manage risks, and stop second-guessing every move. Strategies like day trading, swing trading, and position trading provide traders with the edge they need to outperform the rest in different trading scenarios.
FAQ: Technical Analysis
What’s the difference between technical and fundamental analysis?
Imagine them as two different lenses to look at stocks through. Technical analysis is like studying the “footprints” of a stock—using charts, past prices, and trading volume to spot trends and patterns that might hint at where it’s headed next. Fundamental analysis, on the other hand, digs into the “why” behind a stock’s value, like company earnings, industry health, or economic factors. It’s more about whether a stock is undervalued or overvalued based on real-world data.
What are the advantages of using technical analysis?
You gain a trading edge over other traders, knowledge is power, and with technical analysis you learn to make smarter decisions based on many affecting factors such as charts, trends, indicators, and patterns.
Which chart type is best for beginners in technical analysis?
We recommend line charts for beginners due to their simplicity. You get a clearer view of price trends without the complexity and messiness of candlestick or bar charts. However, eventually you’ll be doing a more thorough analysis and candlestick and bar charts will become inevitable.
How do moving averages make trends easier to spot?
Imagine smoothing out a bumpy road so you can see if it’s generally sloping up or down. Moving averages do this by averaging prices over days or weeks, filtering out random ups and downs that don’t make much sense. If the price stays above a rising moving average, that’s a good sign the trend is up—and vice versa.
Why do traders care so much about support and resistance levels?
Picture support levels as price floors where buying pressure increases the closer a stock’s price reaches the support level, while on the other hand, resistance levels act as price ceilings where selling pressure intensifies the closer a stock’s prices gets to it. These levels allow traders to set strategic entry points (near support) or exit points (near resistance).
Why are Bollinger Bands so useful in trading?
Bollinger bands (which track volatility) are used to identify when a stock may be overbought or oversold. Picture Bollinger Bands narrowing like a camera lens focusing. When they widen, it’s the ‘click’—suddenly everything sharpens, and the market’s next big move snaps into view.
What does the Relative Strength Index (RSI) indicate?
To put it simply, the RSI indicates price momentum, if the value is above 70, this signals overbought conditions while below 30 indicates oversold conditions.
How do chart patterns predict market reversals?
Chart patterns such as “head and shoulders” or “double tops” act as warning signs for traders. For example, a “double top” (two failed attempts to break a high), usually is a sign that buyers are losing steam, and therefore a downturn is likely to follow. It’s like reading tire tracks to guess where a car might swerve next.
Does technical analysis work for all trading styles?
Yes, but it’s particularly useful for short-term traders like day traders and swing traders who rely on timing and quick decision-making based on price movements.
Can you rely solely on technical analysis to win at trading?
Absolutely not, technical analysis can only help you make informed decisions and should only be used with the goal of improving success rate. We recommend pairing it with risk management and a clear mind, this is mainly what’s required for staying in the game long-term and earning some meaningful profits.
Michelle Sofia
CleaRank started with the simple yet powerful vision that transparent and unbiased broker information should be available to everyone, not just those within the industry. This is where I come in with my many years of experience in financial journalism and SEO. Every day, I focus on creating and refining educational content that truly speaks to trading communities and making it both easy to find and genuinely helpful. It’s all about giving people the knowledge they desperately need in order to make informed decisions—step by step, one article at time.