
Written by Michelle Sofia Michelle Sofia
Market Analyst
As a financial journalist and a SEO specialist my passion for making education in finance accessible runs deep. My work combines hands-on market trend analysis with straightforward writing to create content that’s both informative and easy to understand for the average reader. At CleaRank, we’ve built our reputation on a simple idea: transparent broker comparisons shouldn’t be reserved for experts because everyone deserves clear and transparent information, especially when it comes to choosing a broker. Day to day, I focus on refining our educational materials to maximize their visibility and usefulness across trading communities. using our CLEAR™ Methodology The CLEAR™ Score (Credibility, Leverage, Execution, Accessibility, Regulation) is our proprietary ranking system. The CLEAR™ Score provides you with the most accurate and transparent broker ranking after evaluating all the key factors that are crucial for trading success. .
Last fact checked on July 1, 2025
Stock Fundamental Analysis
Fundamental Analysis, the key to successful stock trading, it’s the process of determining whether a certain stock is a good investment choice by evaluating a company’s financial health, industry position, and overall market potential. While this might sound complex at the beginning, breaking it down into manageable parts will make it much easier for you to apply.
Economic and Industry Analysis
When jumping into individual companies, we initially need to look at the broader economic environment and industry in which a company operates. This will allow us to determine whether the company has the potential to thrive in current market conditions or hit headwinds that will kill our profitability.
Economic Analysis
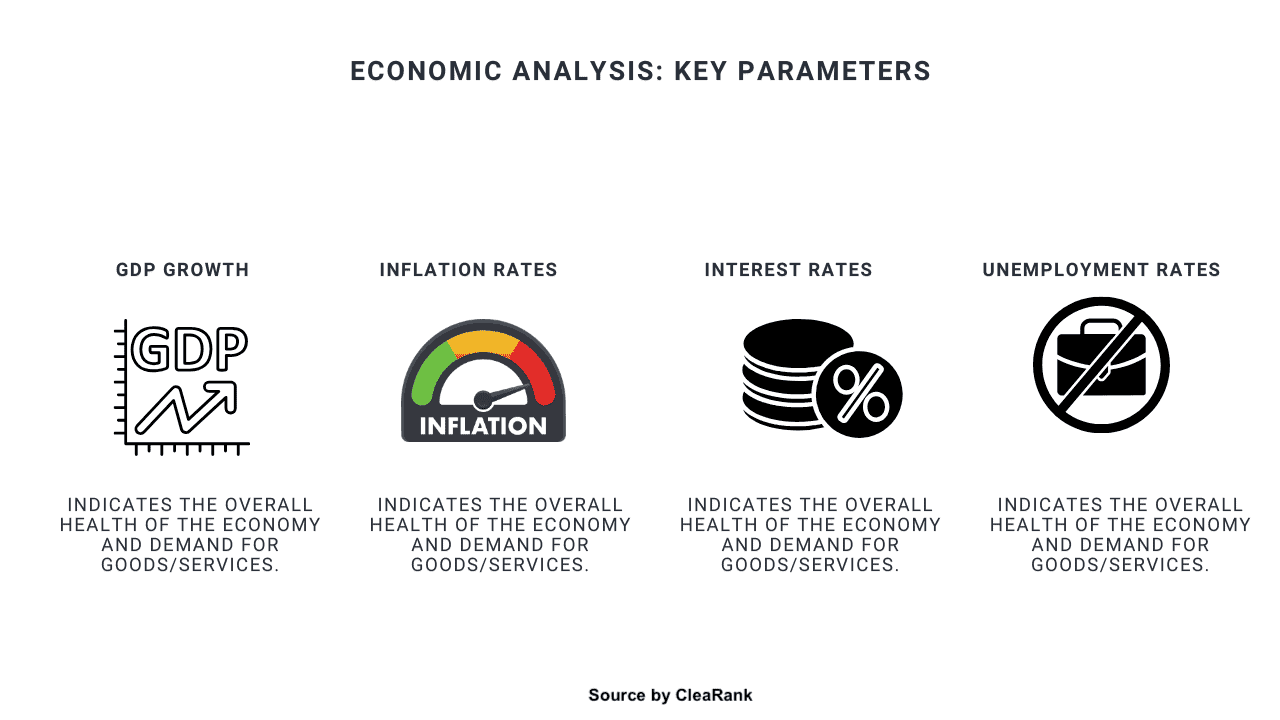
A nation’s economic conditions directly influence corporate performances. The primary indicators to monitor are:
- GDP Growth: This is the monetary measurement of a nation. Simply put, this is the total value of everything people make and do there. If the GDP grows, it’s an indicator that the whole country is doing well—businesses are busy, people are earning and spending, and the economy is getting bigger. If it shrinks, it’s a sign of sales slowing down, and everyone might need to tighten their belts a bit.
- Inflation Trends: It’s simple logic, when prices rise, consumers spend less. This is impactful for sectors like retail or manufacturing.
- Interest Rate Policy: Can be significant for interest-sensitive industries such as real estate or banking. The Central banks are responsible for determining the interest rates. If interest rates rise, it means that credit cards, car loans, and mortgages cost more each month, so people and businesses will have no choice but to spend less (for savers, it can be good news as banks pay more for keeping your cash in savings accounts).
- Employment Data: Strong job markets typically spike consumer confidence and discretionary spending, which is beneficial for cyclical sectors like travel and luxury goods.
We can take advantage of these metrics to get a basic idea of the current market conditions and decide whether now is a good time to invest.
The conditions of a market are what shape its performance. Indicators like GDP growth, inflation, interest rates, and employment levels can directly impact a company’s profitability and stock price
Economic Indicator | Why It Matters |
|---|---|
GDP Growth | This Indicates the strength of the economy and demand for goods/services. |
Inflation Rate | High inflation can kill purchasing power and increase expenses for companies. |
Interest Rates | Higher rates increase borrowing costs, this reduces profits for businesses and investors. |
Unemployment Rates | Lower unemployment usually signals stronger consumer spending. If the economy is making more, they are also spending more |
Usually when there’s an economic boom then sectors like technology and luxury goods perform well, while in a downturn the defensive industries such as healthcare and utilities often tend to be safer investments.
Industry Analysis
Once you understand the economic backdrop, the next step is evaluating the industry in which a company operates.
Industry Factor | What to Analyze |
|---|---|
Market Trends | Look at growth rates, emerging technologies, and demand patterns. |
Competitive Landscape | Valuate the level of competition and the company’s position within the industry you’re analyzing. |
Regulatory Environment | Determine if regulations could positively or negatively affect the industry. |
Example: If you’re analyzing a renewable energy company, consider how global trends like the shift toward green energy and government incentives might boost its prospects.
Company Analysis: Financial Statements and Ratios
Now that we understand the economic and industry context, we can focus on the company itself–this is where it gets more interesting and creative, but also most important so pay attention.
To properly figure out a company’s health and performance, we will investigate their financial statements and different key ratios, by doing so we gain a wealth of information that points to the direction a company is heading.
Financial Statements
There are three main financial statements that are essential for evaluating a company:
Statement | What It Shows |
|---|---|
Income Statement | This represents revenue, expenses, and net profit over a specific period. |
Balance Sheet | The balance sheet displays assets, liabilities, and shareholder equity, showing the company’s financial position. |
Cash Flow Statement | By tracking cash inflows and outflows, you can understand a company’s liquidity. |
Key Points to Analyze:
Revenue Growth: This is quite straightforward, steady increases in revenue suggest a company is expanding.
Profit Margins: High margins indicate efficient cost management.
Debt Levels: Excessive debt can be a red flag, and potentially bankrupt a business–especially during economic downturns.
Cash Flow: When a company has a positive cash flow then it will probably meet its monetary obligations.
Financial Ratios
Ratios help you compare a company’s performance in relation to its competitors or historical data.
Ratio | Purpose |
|---|---|
Price-to-Earnings (P/E) | A measurement for how much investors are willing to pay for $1 of earnings. |
Debt-to-Equity (D/E) | Indicates the proportion of debt relative to equity, showing financial leverage. |
Return on Equity (ROE) | Showcases how effectively the company generates profits from shareholders’ equity. |
Current Ratio | The company’s ability to pay short-term obligations with current assets. |
Practical Application: If Company A has a P/E ratio of 15, it means investors are paying $15 for every $1 of earnings. We can now compare Company A to the industry average to help us determine if the stock is overvalued or undervalued.
You can gain access to a company’s financial statements and other relevant documents through The Securities and Exchange Commission’s (SEC) EDGAR database and the FactSet datasets.
Valuation Techniques
Valuation techniques are the heart of fundamental analysis. With them you can successfully determine the intrinsic value of a stock to see if it’s trading at a fair price or is affected by temporary hype.
These are the different valuation techniques to begin with:
Discounted Cash Flow (DCF)
The DCF method represents a stock’s value by calculating the present value of its expected future cash flows.
How the DCF Analysis works in practice:
Forecast Future Cash Flows: Analyze the company’s financial trajectory to project its free cash flows over a defined period, typically 5–10 years. This requires you to evaluate historical performance, growth prospects, and industry trends.
Determine the Discount Rate: Apply a discount rate, often the Weighted Average Cost of Capital (WACC), to account for the time-value of your money and the inherent risks.
Calculate Terminal Value: You need to estimate cash flows beyond the projection period using a terminal value.
Sum and Compare: At the end, we combine the discounted cash flows and terminal value to get the total intrinsic value. If this value is above the stock’s current market price, the stock may be undervalued, which means it might be a buying opportunity for us. If this value is below the stock’s current market price, the stock may be overvalued.
Comparable Company Analysis (CCA)
This method involves comparing the company’s valuation metrics (like P/E ratio or EV/EBITDA) to similar companies in the same industry.
Example 1:
If the average P/E ratio of the renewable energy sector is 20, and the company you’re analyzing has a P/E ratio of 12, it could be undervalued relative to its peers.
Example 2:
Company A: EV = 10 B, EBITDA=2B → EV/EBITDA = 5x.
Company B: EV = 15 B, EBITDA=3B → EV/EBITDA = 5x.
Both trade at the same multiple. This indicates similar valuation despite the clear difference in sizes between both companies.
Dividend Discount Model (DDM)
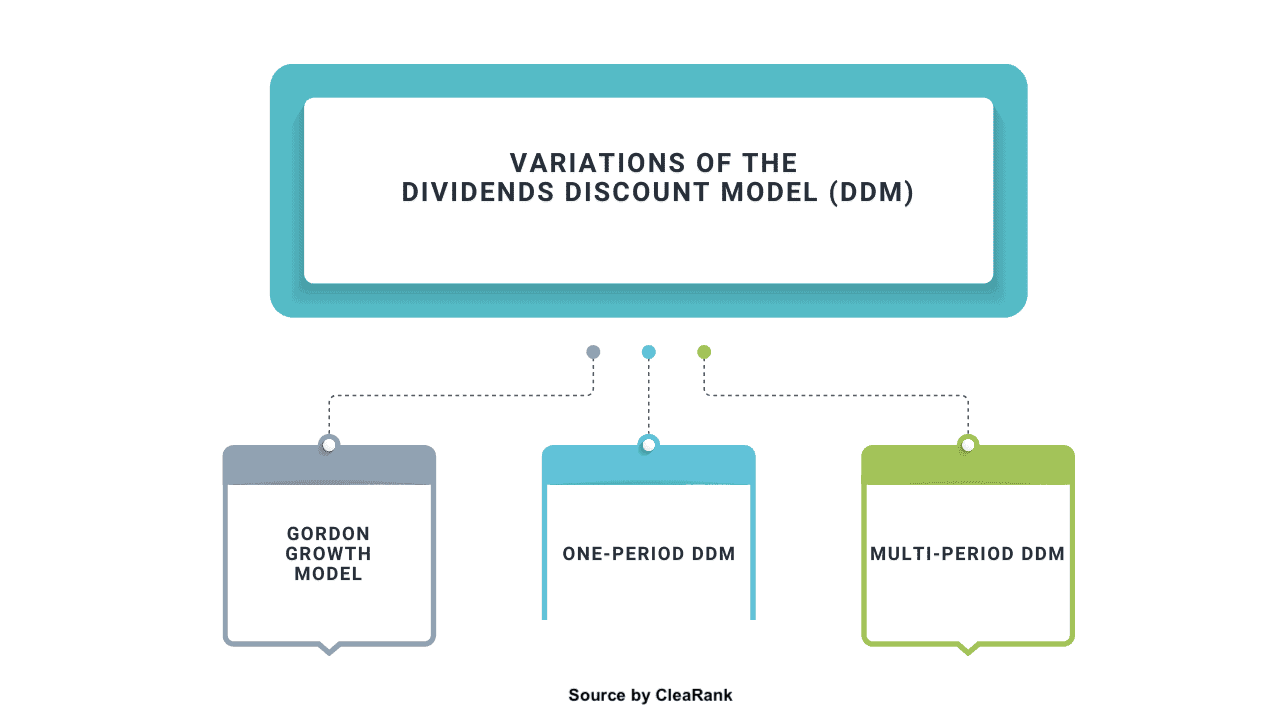
The DDM is a time-tested method of a stock’s intrinsic value by calculating the present value of its expected future dividends. This method is used when focusing on companies such as Coca-Cola and Johnson & Johnson that consistently pay dividends. These consistent payouts reflect the companies’ financial health and commitment to the shareholders.
Formula for the Gordon Growth Model:

Where:
- Intrinsic Value = The estimated fair value of the stock
- Dividend Per Share = Expected annual dividend payment per share
- Discount Rate (r) = The investor’s required rate of return (or cost of equity), often derived from benchmarks like the S&P 500’s historical returns (e.g., 8% or 0.08).
- Dividend Growth Rate (g) = Expected annual growth rate of dividends
Example:
If a company pays a dividend of $2 per share, the required rate of return is 8% (0.08), and the dividend growth rate is 3% (0.03),
the intrinsic value is calculated as:
Intrinsic Value = 2/(0.08-0.03) = 2/0.05 = $40
So, the intrinsic value of the stock is $40.
Earnings Reports and Forecasting
Earning reports are one of the best resources you can use for fundamental analysis. They are released quarterly and give us a snapshot of the company’s financial health. Earning reports often include the company’s future expectations and roadmap.
Focus on These Main Metrics in Earnings Reports
Metric | What It Indicates |
|---|---|
Earnings Per Share (EPS) | Measures the company’s profitability on a per-share basis. |
Revenue Growth | Shows how well the company is expanding its top line. |
Operating Margin | Reflects how efficiently the company is managing its operations. |
Forward Guidance | Provides insight into the company’s future expectations and growth plans. |
Example: If a company reports higher-than-expected EPS and raises its forward guidance, it often leads to a stock price increase.
EPS are usually provided in two ways. One is a representation of the company’s past performance and the other is what the company expects in future earnings. But if there are two types of EPS, does that mean there are two types of P/E ratios? Yes, it does.
Forecasting Stock Performance
When trying to forecast a stock’s performance, we must carefully analyze earnings reports, industry trends, and different economic factors in order to minimize risk. Tools like analyst consensus estimates and revenue projections provide critical signals regarding the probability of how the stock price will react in the future.
Practical Application of Fundamental Analysis
If we put it all together, fundamental analysis allows you to identify high-quality stocks that align with your goal of making money. Start by looking at the broader economic environment, then you should narrow it down to specific industries with high growth potential, and afterwards move on to evaluate individual companies using the resources and valuation methods that were mentioned in this guide.
What’s Next: Technical Analysis
Fundamental analysis focuses on the intrinsic value of a stock, next up is technical analysis, which is very different from fundamental analysis. Technical analysis looks at price movements and trading volumes to identify trends and patterns we can take advantage of. In the next section, we’ll explore together how to use charts, indicators, and oscillators. Combining both analysis approaches will give you a powerful toolset and will build your confidence to tackle the stock market successfully even during the most challenging conditions.
FAQ: Fundamental Analysis
What makes fundamental analysis important in stock trading?
Fundamental analysis allows us to evaluate individual companies’ financial health, industry position, and market potential to determine if its stock is a good investment.
How does economic analysis affect stock evaluation?
Economic analysis combines different metrics to portray a clear picture of the current market conditions and whether now is a good time to invest.
Why is industry analysis crucial before analyzing individual companies?
You need to first understand the macro environment in which a company operates and its potential to succeed as without understanding the bigger picture, drilling down to finer resolutions is meaningless. Industry analysis reveals growth trends, competition, and regulatory impacts—all these factors will eventually play a significant role in your individual company analysis.
What are the key financial statements used in fundamental analysis?
The income statement shows profitability, the balance sheet outlines financial stability, and the cash flow statement identifies liquidity and how effectively the company is operating.
How do financial ratios improve company comparisons?
Ratios like P/E, ROE, and D/E help compare a company’s performance against industry average in order to understand its real market valuation and operational efficiency.
What valuation techniques are commonly used in fundamental analysis?
Common valuation techniques are DCF, CCA, and the DDM. These key valuation techniques help us determine whether a stock is overvalued, undervalued, or fairly priced.
How do earnings reports assist in fundamental analysis?
Earnings reports are a snapshot of a company’s recent performance and future expectations.
Can fundamental analysis predict stock performance?
It’s important to understand that fundamental analysis alone doesn’t guarantee outcomes (nothing does). However, it can identify rough diamonds such as undervalued stocks and it can forecast performance to provide investment clarity.
How does fundamental analysis differ from technical analysis?
Fundamental analysis focuses on the intrinsic value of a stock and the macro picture, while technical analysis uses charting tools, past pricing history, and trading volumes, to identify future trends and patterns we can jump on.
Is fundamental analysis suitable for all types of investors?
Yes, but it’s particularly useful for long-term investors who want to build a strong investment portfolio of high-quality, value-driven stocks. Short-term traders should always combine it with technical analysis to confirm buying or selling signals.
Michelle Sofia
CleaRank started with the simple yet powerful vision that transparent and unbiased broker information should be available to everyone, not just those within the industry. This is where I come in with my many years of experience in financial journalism and SEO. Every day, I focus on creating and refining educational content that truly speaks to trading communities and making it both easy to find and genuinely helpful. It’s all about giving people the knowledge they desperately need in order to make informed decisions—step by step, one article at time.